> ## Documentation Index
> Fetch the complete documentation index at: https://summation-676748f5-docs-api-and-integrations.mintlify.site/llms.txt
> Use this file to discover all available pages before exploring further.

# Create your first report

> A step-by-step walkthrough to import data, generate a report, and refine it with Addison.

<Note>
  This guide walks you through creating your first report in Summation — from importing data to generating an AI-powered analysis to refining it with follow-up questions.
</Note>

## Open your project

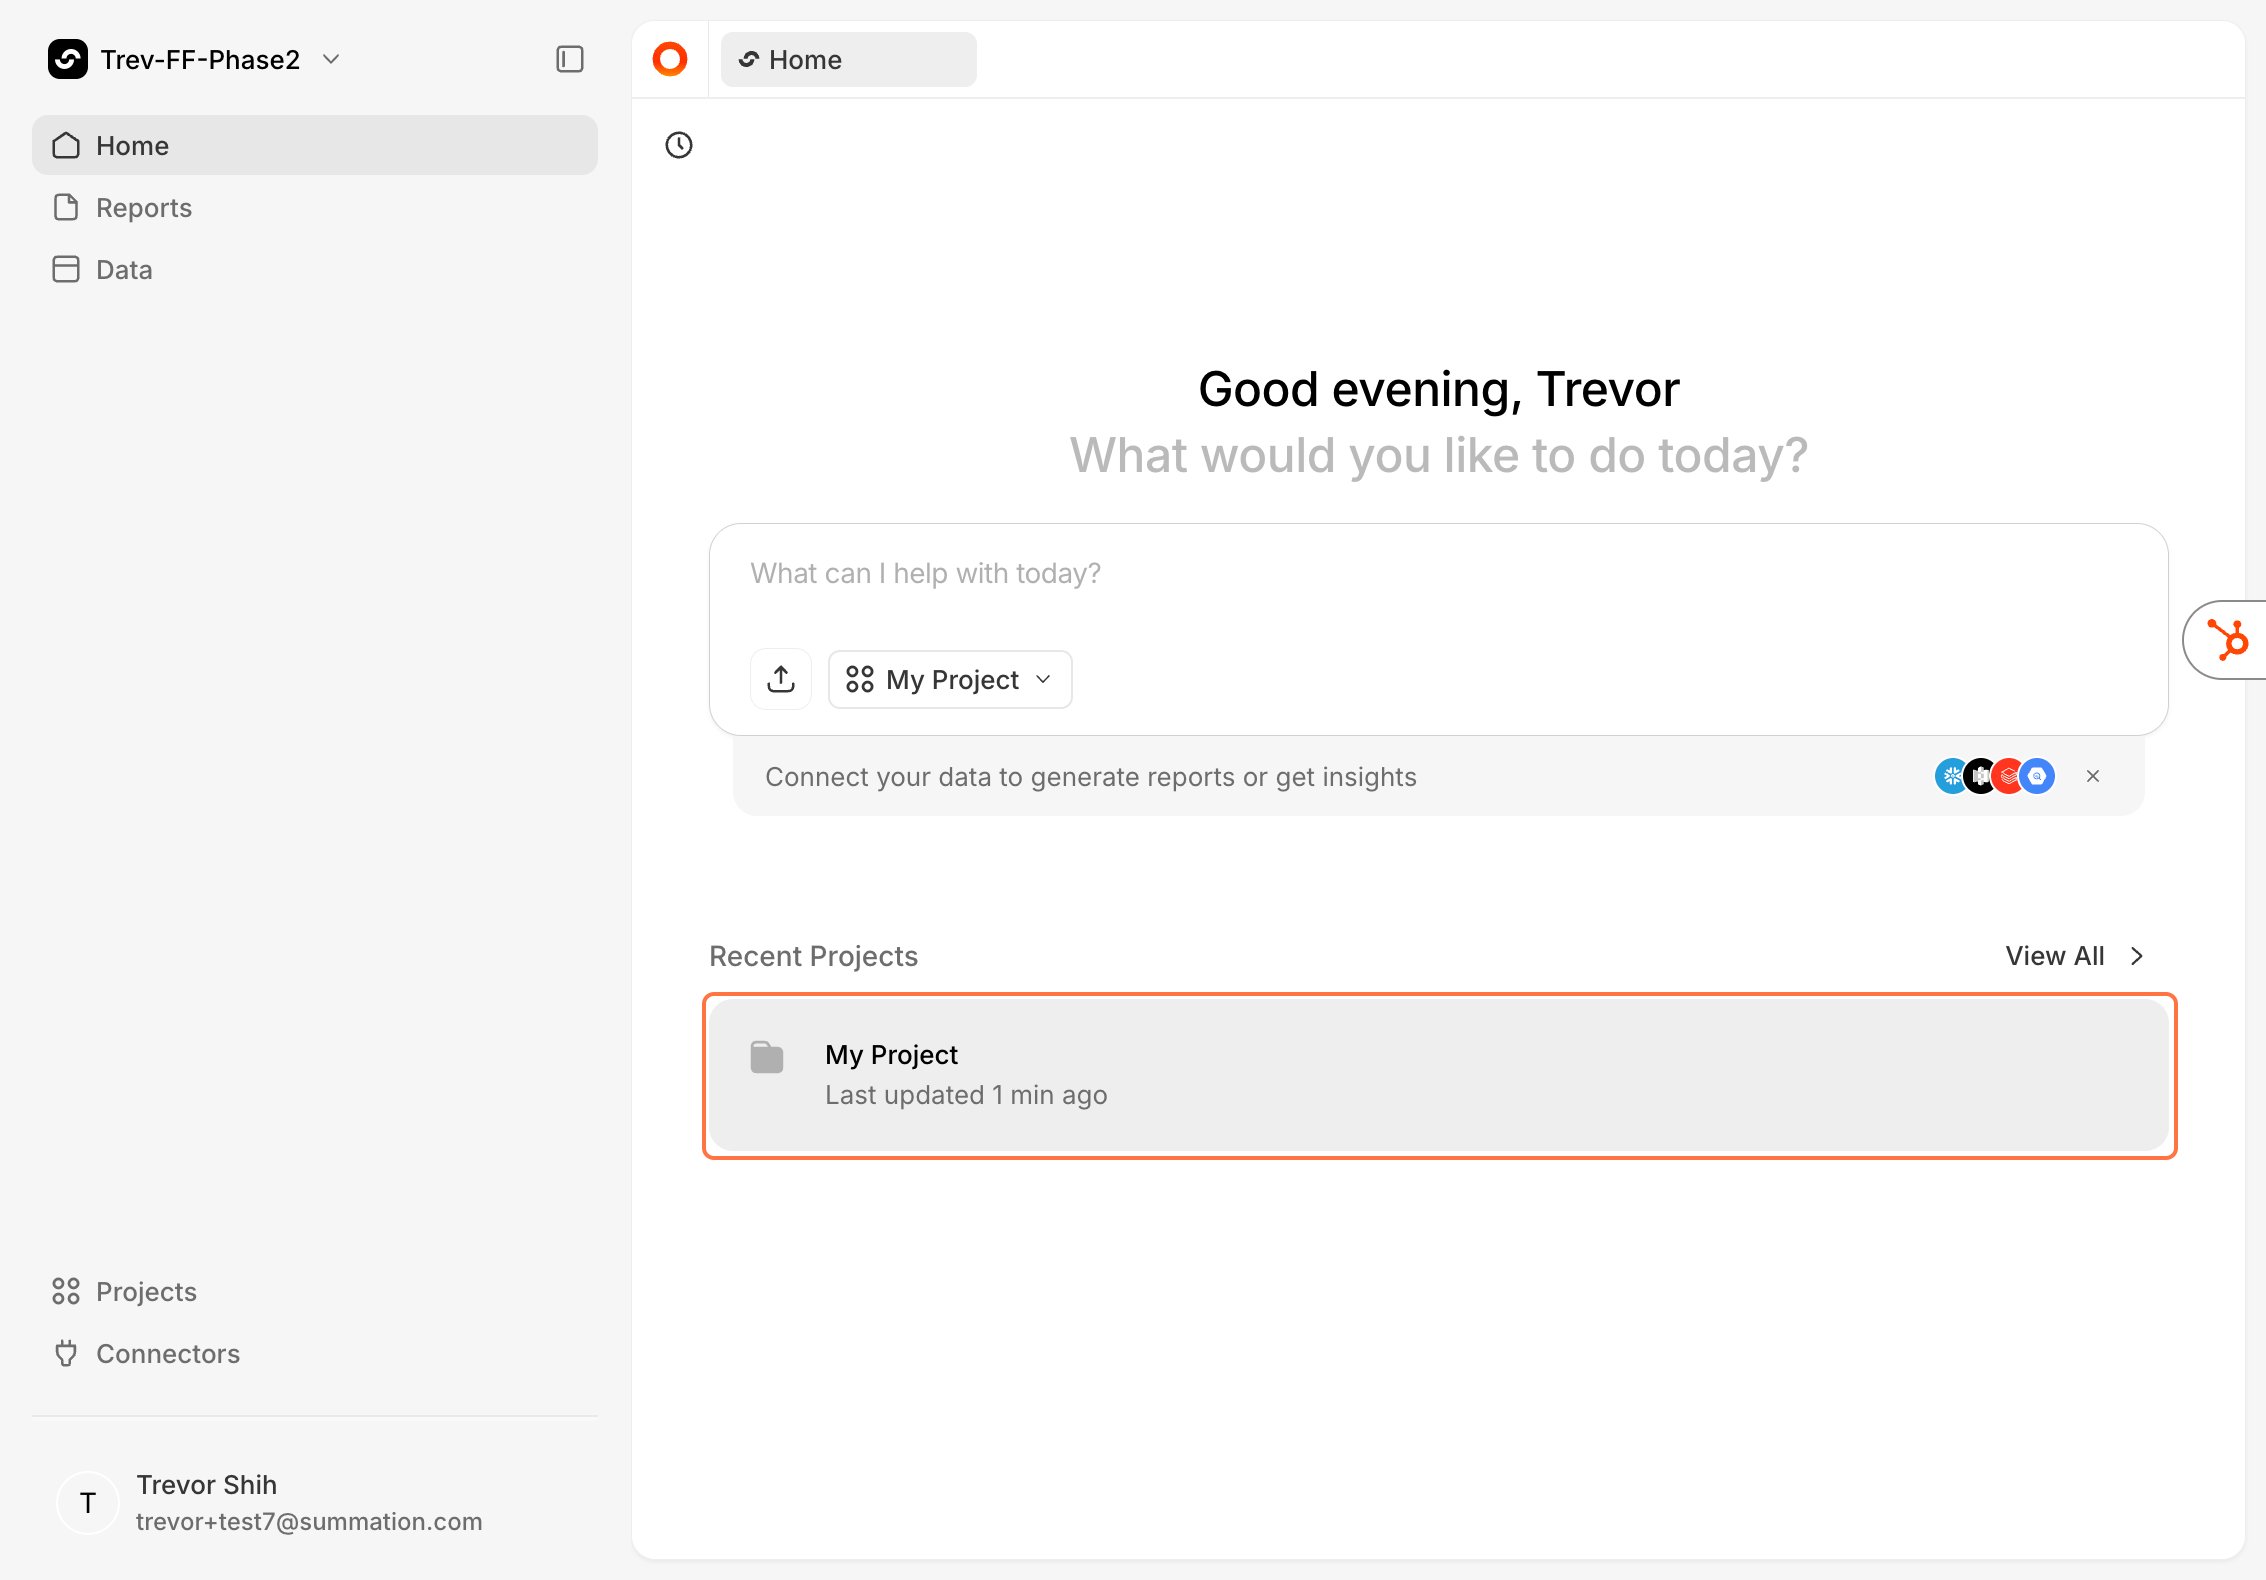
Open your project from **Recent projects** on the home page, or click **Projects** in the sidebar and select it from the list.

For this guide, click on **<Tooltip tip="My Project is a special private workspace for organizing and refining analysis artifacts like reports and playbooks — it will always remain private to you.">My Project</Tooltip>** to get started.

<Tip>
  To collaborate with your team, create a new project. New projects can be shared with collaborators.
</Tip>

<Frame>
  <img src="https://mintcdn.com/summation-676748f5-docs-api-and-integrations/zweiW-5lpFAjuEBM/images/my%20project%20in%20home.png?fit=max&auto=format&n=zweiW-5lpFAjuEBM&q=85&s=6531d228375b5aa3b9301bf43c4db0db" alt="Click on My Project to get started" width="2266" height="1580" data-path="images/my project in home.png" />
</Frame>

## Connect your data

Before importing data into a project, you need to set up a connection. You can upload a spreadsheet directly or connect a data warehouse from the **Connections** page.

<Tabs>
  <Tab title="Upload a spreadsheet">
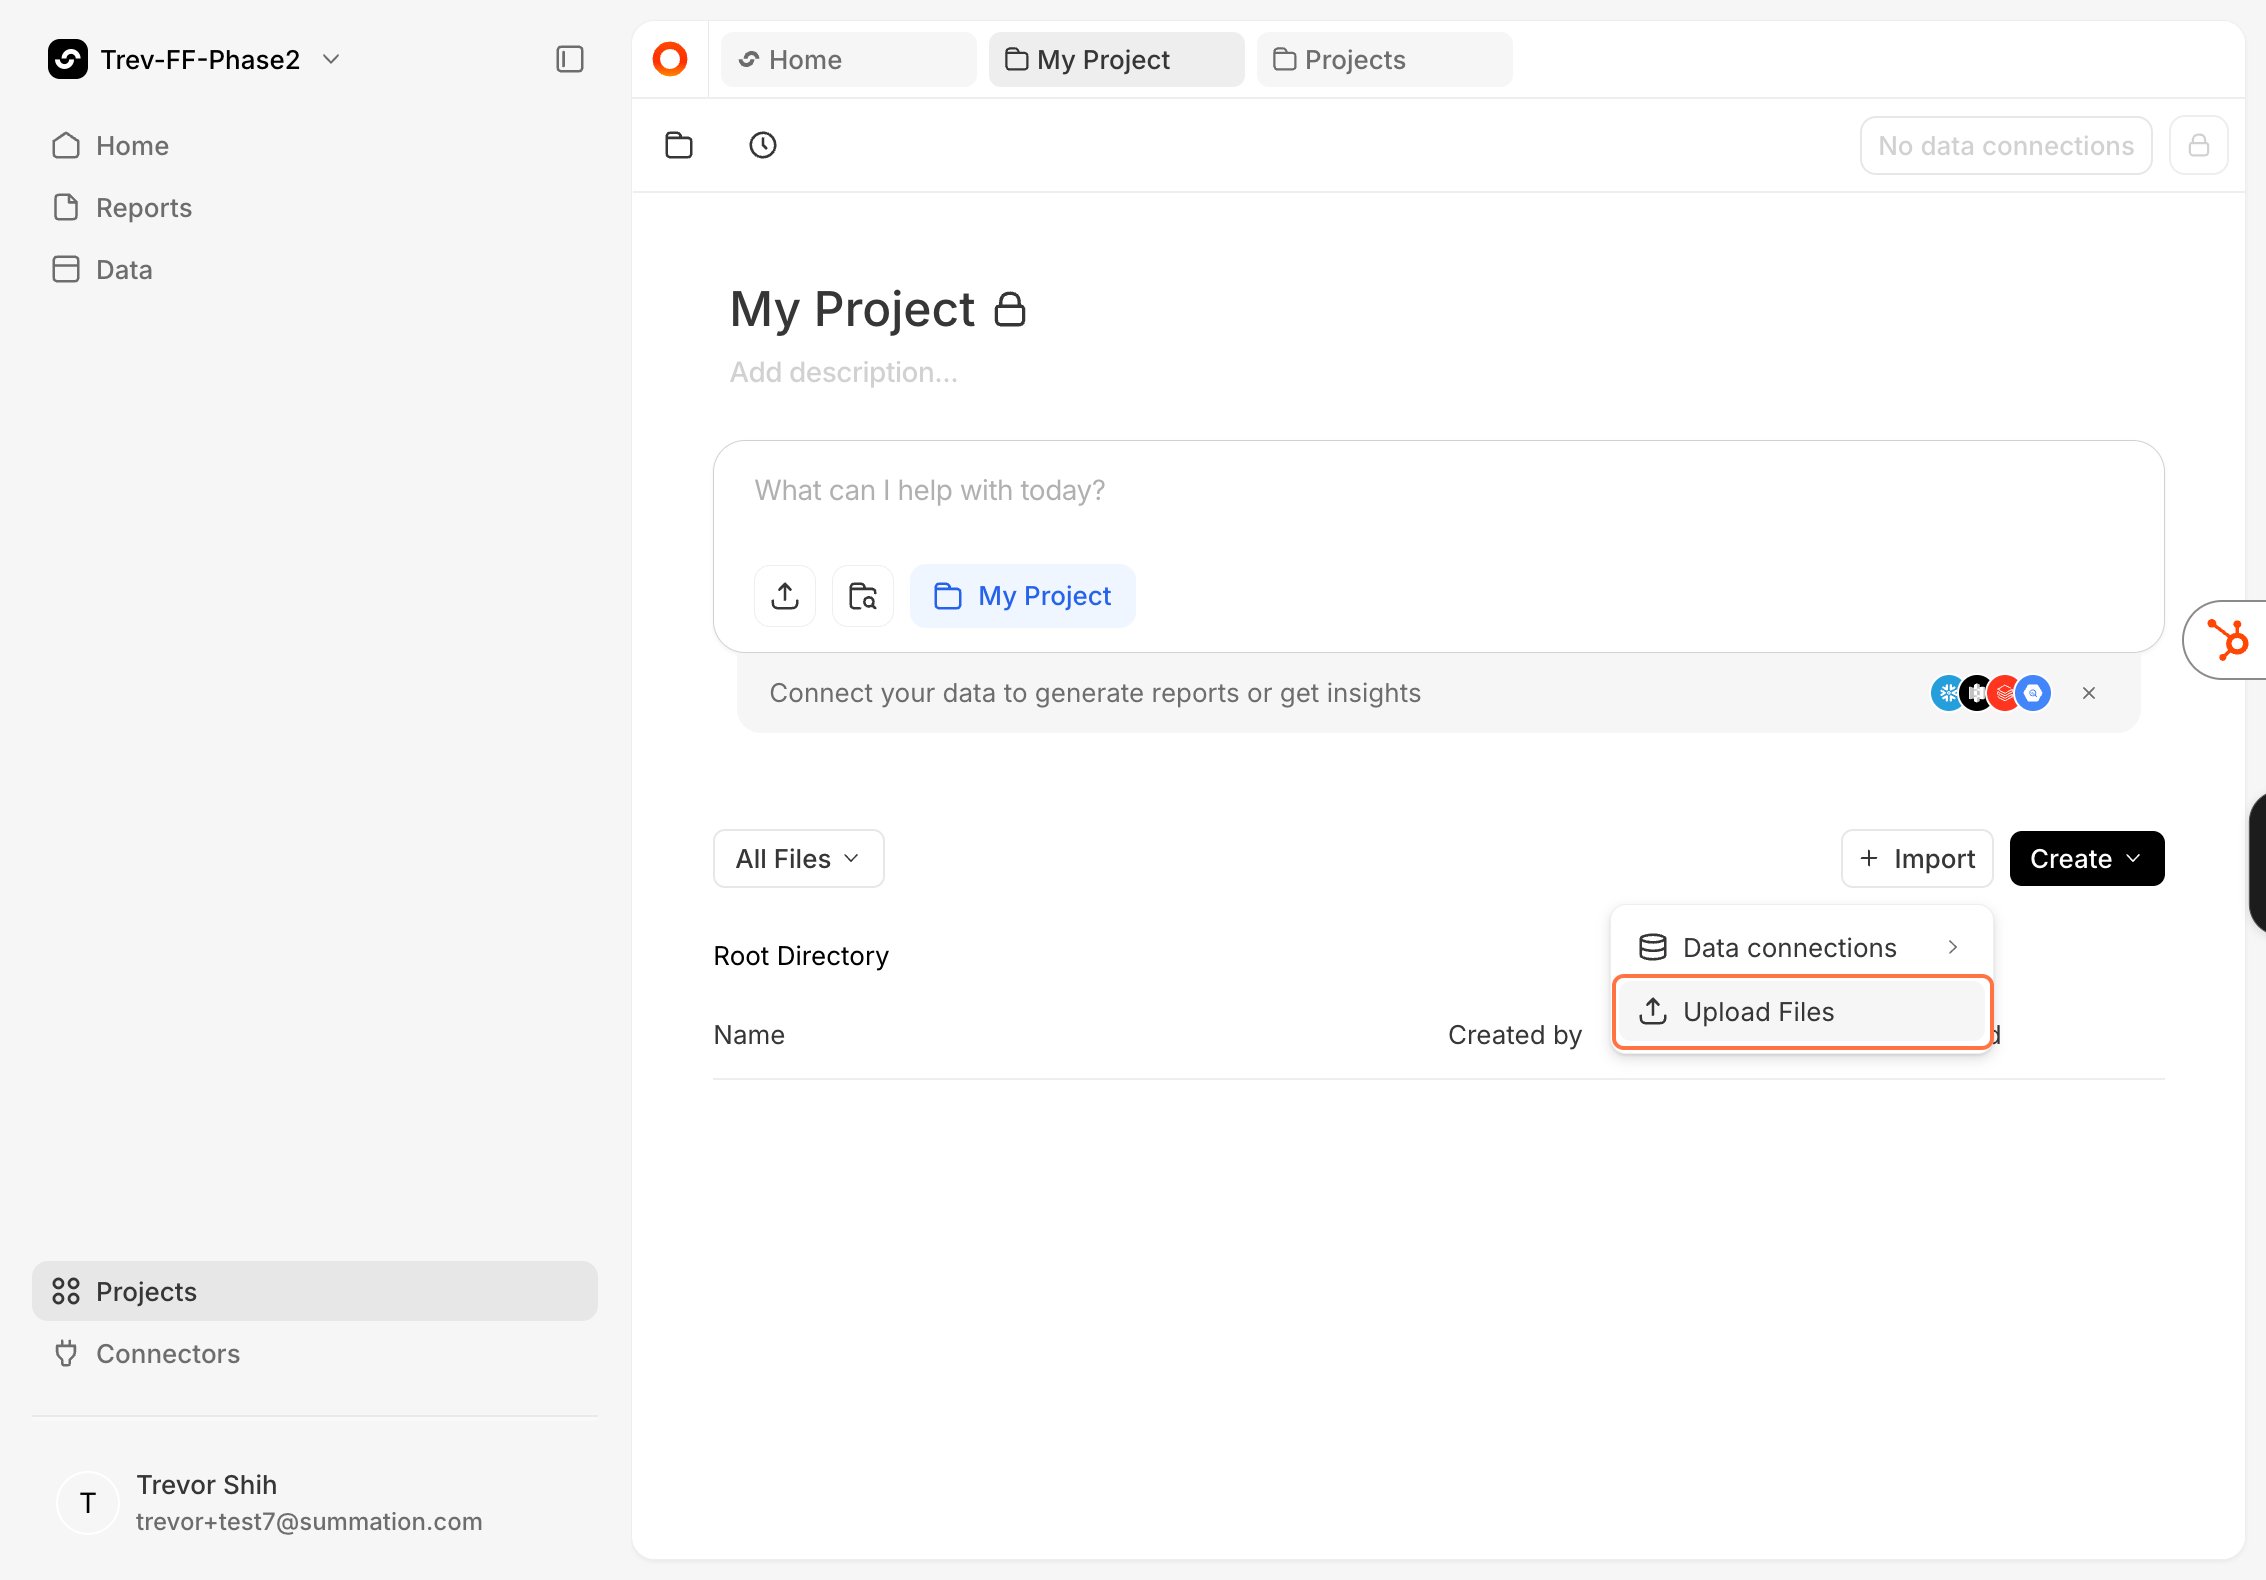
    From inside your project, click **+Import** then **Upload Files** to upload a CSV or Excel file.
    <Frame>
      <img src="https://mintcdn.com/summation-676748f5-docs-api-and-integrations/zweiW-5lpFAjuEBM/images/import%20%3E%20upload%20files%20button.png?fit=max&auto=format&n=zweiW-5lpFAjuEBM&q=85&s=daafd38cadcc3e65113d5716e5f7443a" alt="Click Import then Upload Files" width="2266" height="1580" data-path="images/import > upload files button.png" data-optimize="true" data-opv="3" srcset="https://mintcdn.com/summation-676748f5-docs-api-and-integrations/zweiW-5lpFAjuEBM/images/import%20%3E%20upload%20files%20button.png?w=280&fit=max&auto=format&n=zweiW-5lpFAjuEBM&q=85&s=4eb81d28358cf3e1bec4a1c5320e0f90 280w, https://mintcdn.com/summation-676748f5-docs-api-and-integrations/zweiW-5lpFAjuEBM/images/import%20%3E%20upload%20files%20button.png?w=560&fit=max&auto=format&n=zweiW-5lpFAjuEBM&q=85&s=86af46c89fe30b912e6b625d8a16d777 560w, https://mintcdn.com/summation-676748f5-docs-api-and-integrations/zweiW-5lpFAjuEBM/images/import%20%3E%20upload%20files%20button.png?w=840&fit=max&auto=format&n=zweiW-5lpFAjuEBM&q=85&s=7bfd46e5e4fd85fe76a5c1228bae7898 840w, https://mintcdn.com/summation-676748f5-docs-api-and-integrations/zweiW-5lpFAjuEBM/images/import%20%3E%20upload%20files%20button.png?w=1100&fit=max&auto=format&n=zweiW-5lpFAjuEBM&q=85&s=396d27ee5317b657b259674782e3da98 1100w, https://mintcdn.com/summation-676748f5-docs-api-and-integrations/zweiW-5lpFAjuEBM/images/import%20%3E%20upload%20files%20button.png?w=1650&fit=max&auto=format&n=zweiW-5lpFAjuEBM&q=85&s=0a01d5beb7deb6a5183b2a8d28c7680b 1650w, https://mintcdn.com/summation-676748f5-docs-api-and-integrations/zweiW-5lpFAjuEBM/images/import%20%3E%20upload%20files%20button.png?w=2500&fit=max&auto=format&n=zweiW-5lpFAjuEBM&q=85&s=66467424a7f303e2a0158a26506acb60 2500w" />
    </Frame>
  </Tab>

  <Tab title="Connect a data warehouse">
    Set up your data warehouse connection first, then import the data into your project.

    ### Set up the connection

    <Steps>
      <Step title="Open the Connections page">
        Click **Connections** in the sidebar to open the connections page.

        <Warning>Screenshot needed: Connections page in the sidebar</Warning>
      </Step>

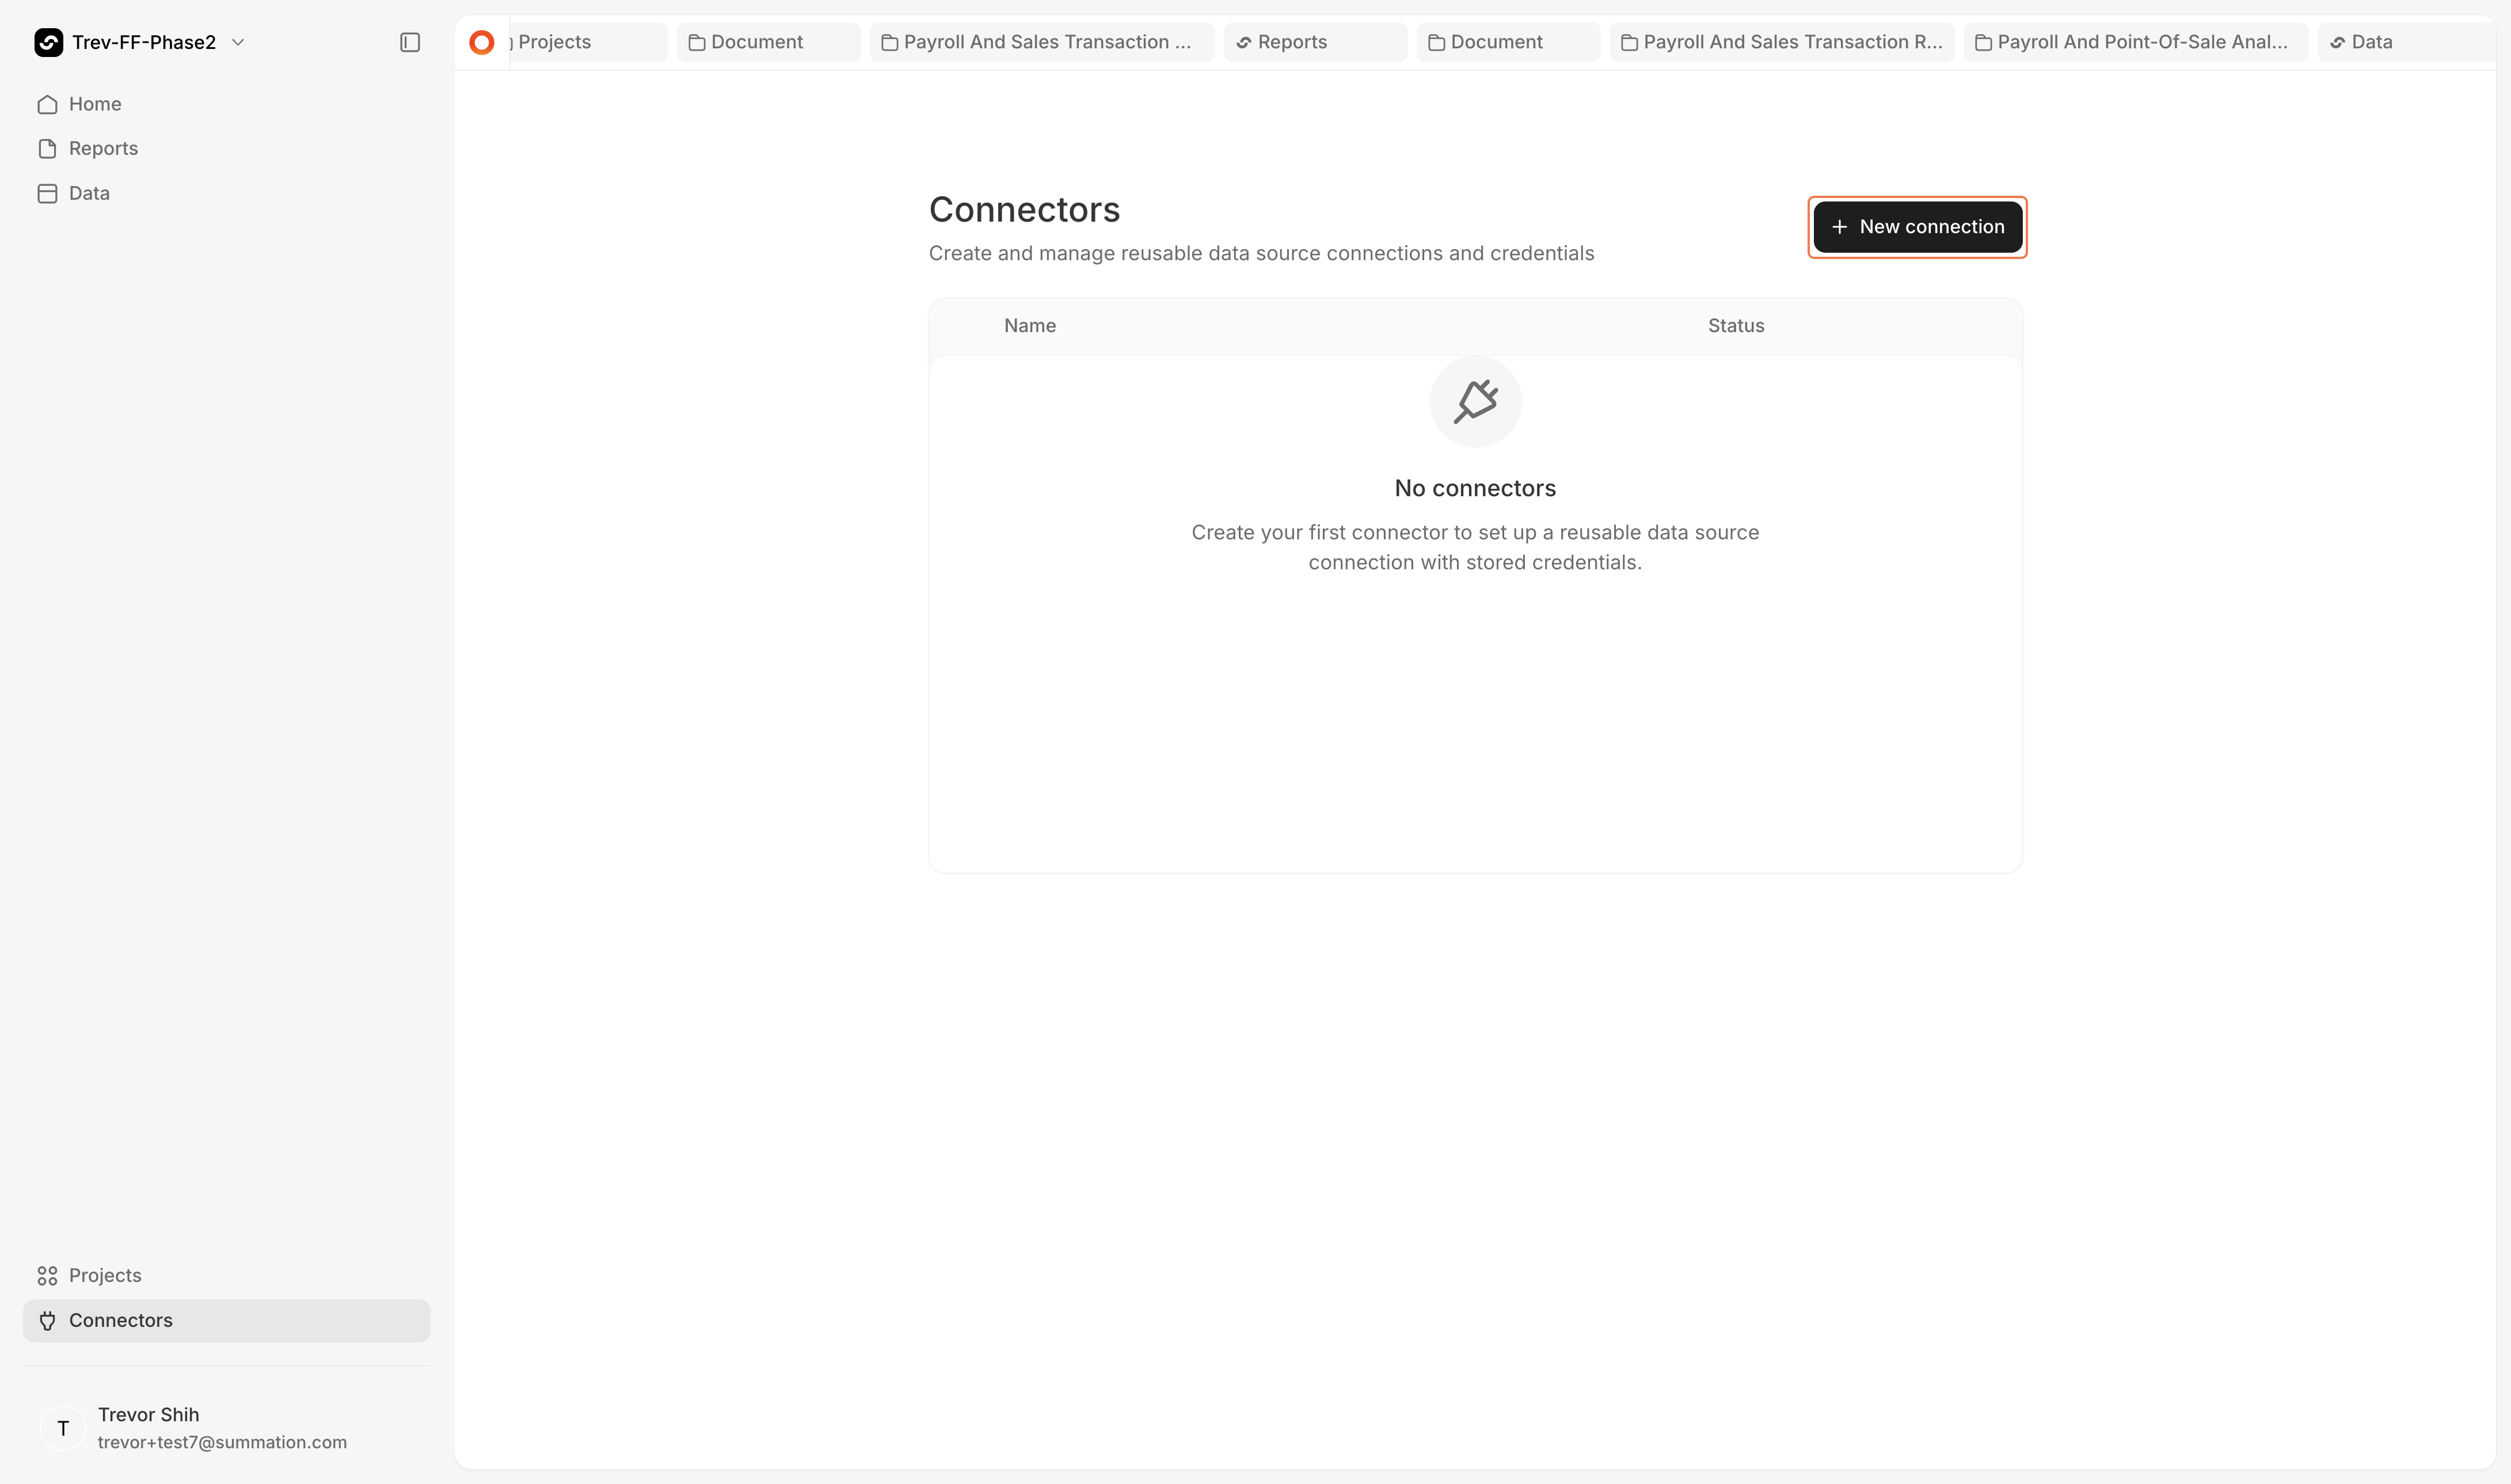
      <Step title="Create a new connection">
        Click **New connection**.

        <Frame>
          <img src="https://mintcdn.com/summation-676748f5-docs-api-and-integrations/zweiW-5lpFAjuEBM/images/new%20connection%20button.png?fit=max&auto=format&n=zweiW-5lpFAjuEBM&q=85&s=1cd17da05ffac01c21d07a763f1fad6c" alt="Click New connection" width="4362" height="2578" data-path="images/new connection button.png" />
        </Frame>
      </Step>

      <Step title="Select your data source">
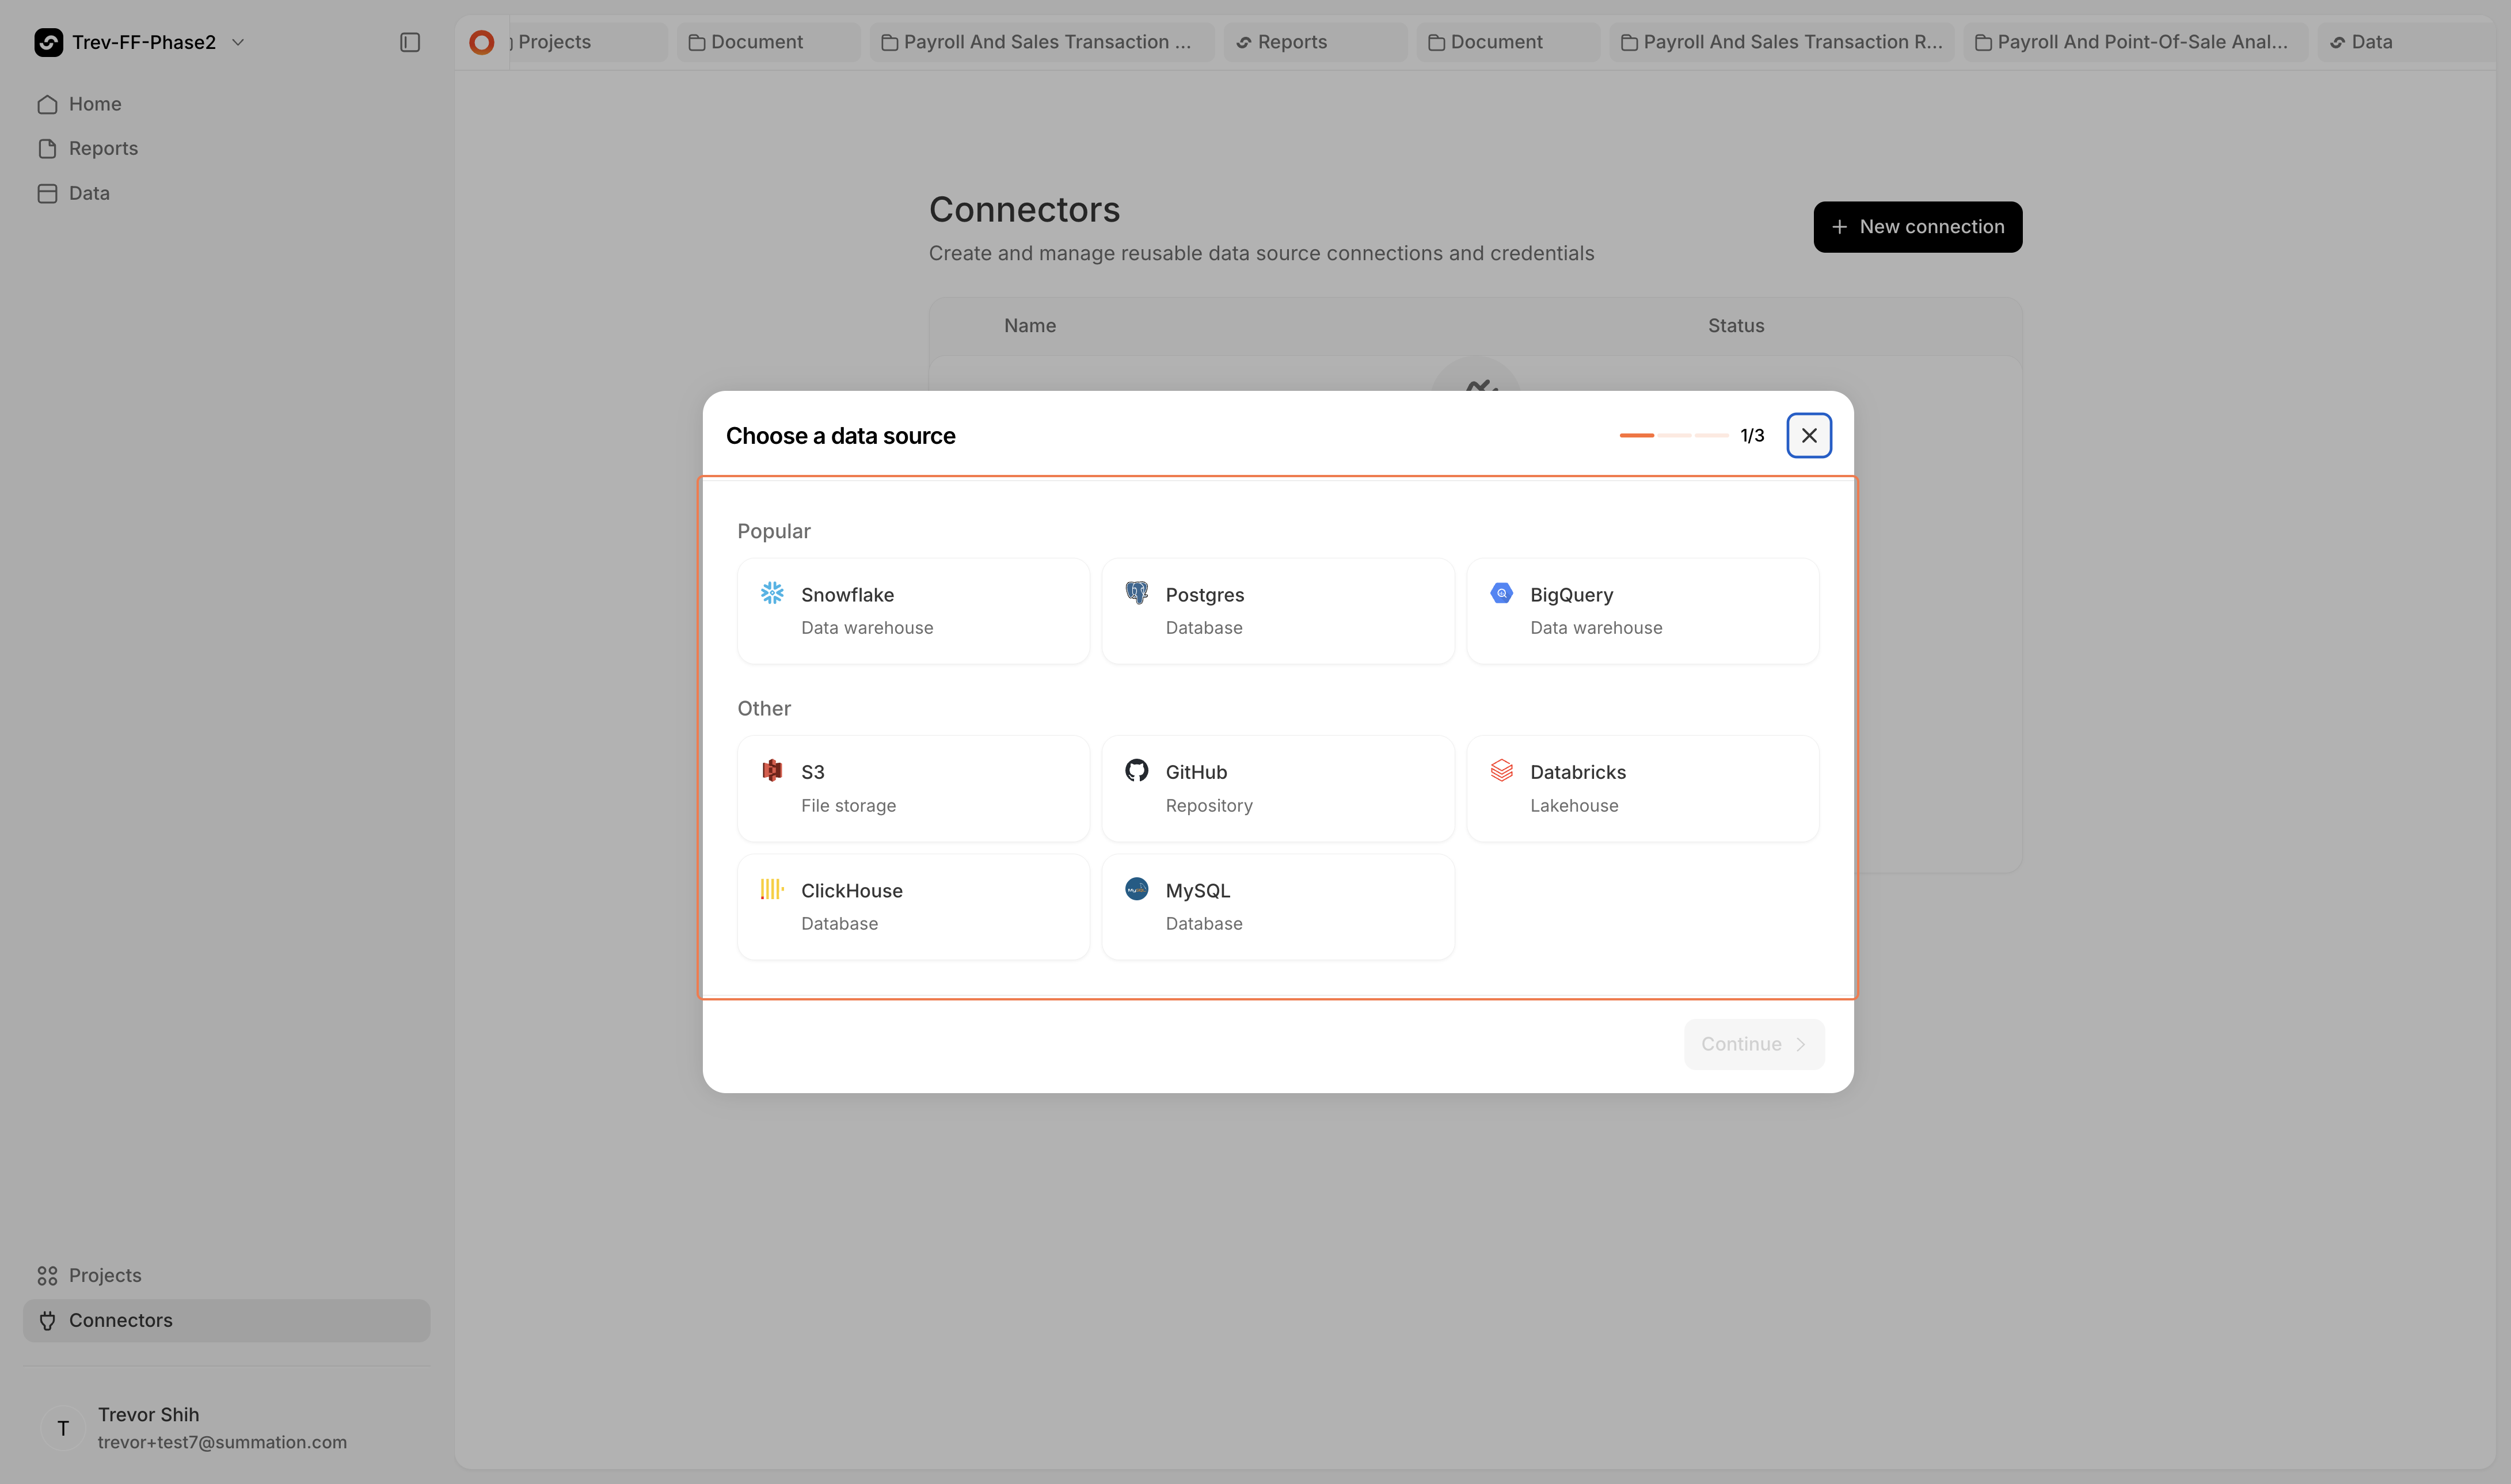
        Choose the appropriate connector (Snowflake, Databricks, BigQuery, etc.).
        <Frame>
          <img src="https://mintcdn.com/summation-676748f5-docs-api-and-integrations/zweiW-5lpFAjuEBM/images/connector%20list%20with%20new%20connection.png?fit=max&auto=format&n=zweiW-5lpFAjuEBM&q=85&s=f1573fdf1ad51a86b625ceefbf6ae5a0" alt="Select data source" width="4362" height="2578" data-path="images/connector list with new connection.png" />
        </Frame>
      </Step>

      <Step title="Enter your credentials">
        <Tip>Click **Test connection** to verify your credentials are correct before proceeding.</Tip>

        <Frame>
          <img src="https://mintcdn.com/summation-676748f5-docs-api-and-integrations/zweiW-5lpFAjuEBM/images/credentials%20form%20with%20test%20connection%20button.webp?fit=max&auto=format&n=zweiW-5lpFAjuEBM&q=85&s=4b197a0b4cc7fe70db0b2484d81e8e43" alt="Credentials form with Test connection button" width="4362" height="2578" data-path="images/credentials form with test connection button.webp" />
        </Frame>
      </Step>

      <Step title="Select your data sets">
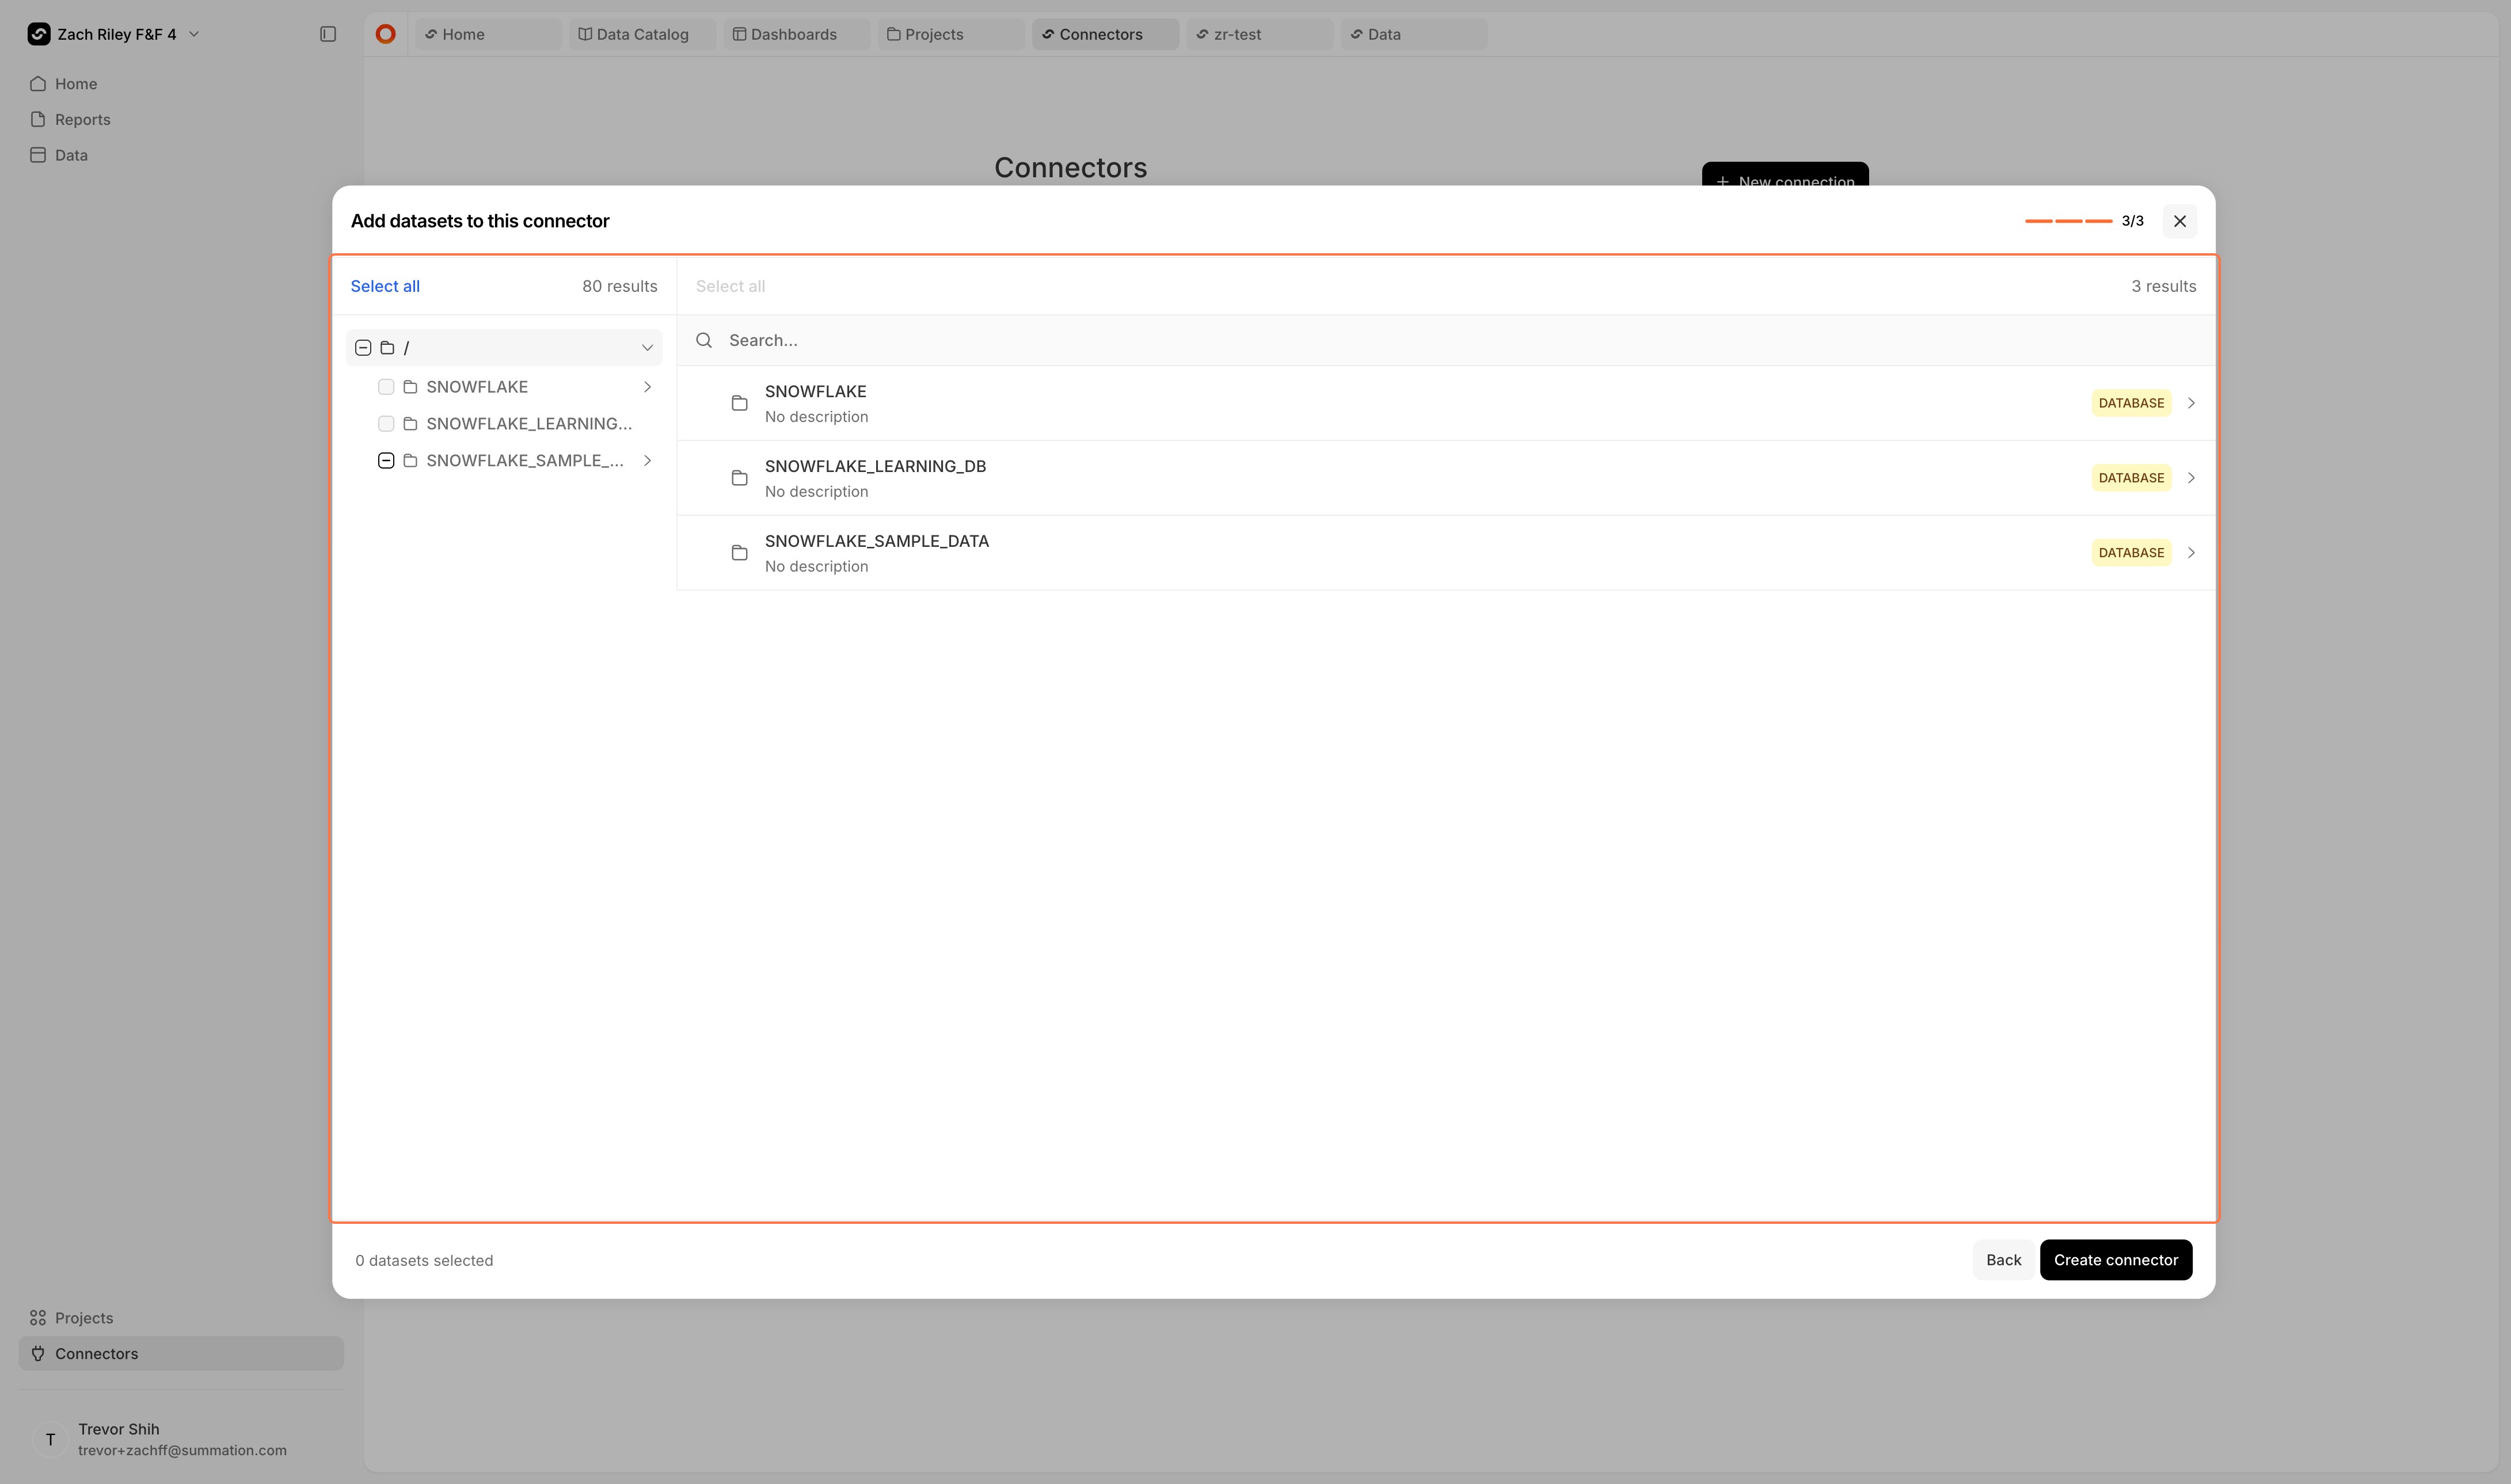
        Choose the tables you want to bring into Summation.
        <Frame>
          <img src="https://mintcdn.com/summation-676748f5-docs-api-and-integrations/zweiW-5lpFAjuEBM/images/data%20set%20selection.webp?fit=max&auto=format&n=zweiW-5lpFAjuEBM&q=85&s=924b62b93732b5175b0ae815bd28a4f2" alt="Select your data sets" width="4362" height="2578" data-path="images/data set selection.webp" />
        </Frame>
      </Step>

      <Step title="View your connection">
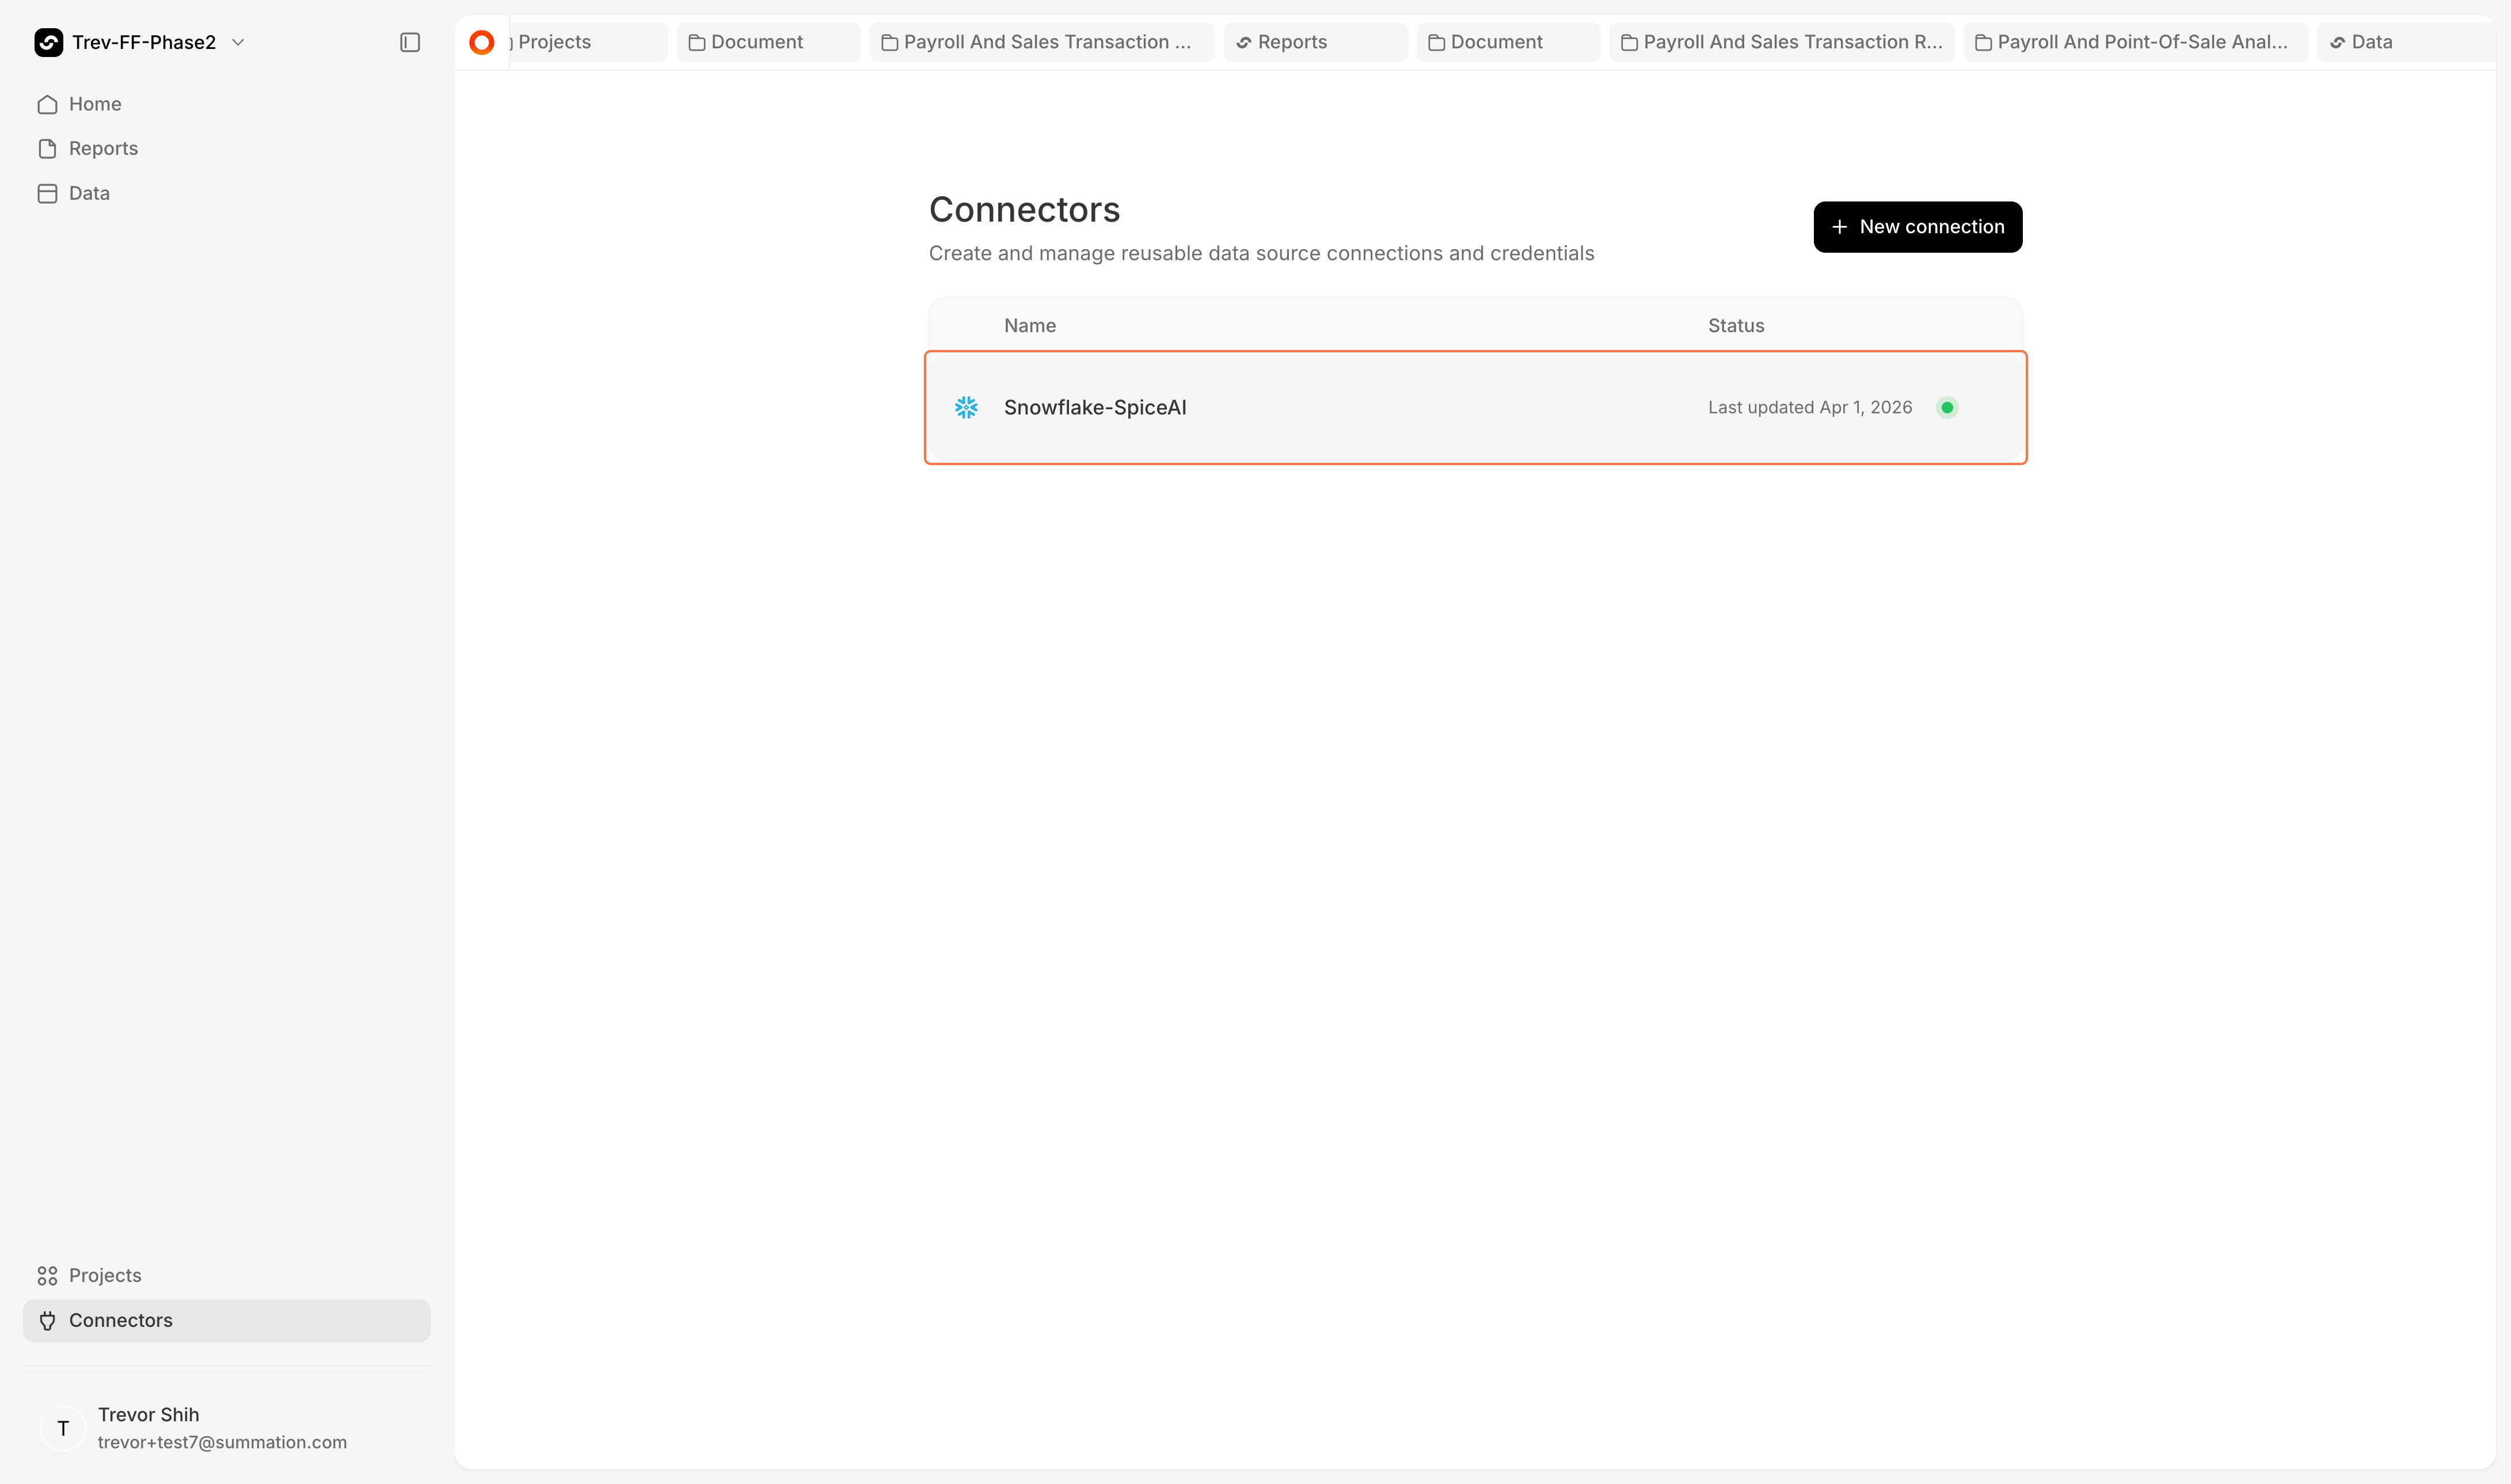
        Once set up, your connector will appear in the connections list.
        <Frame>
          <img src="https://mintcdn.com/summation-676748f5-docs-api-and-integrations/zweiW-5lpFAjuEBM/images/connections%20list%20with%20new%20connector.webp?fit=max&auto=format&n=zweiW-5lpFAjuEBM&q=85&s=3a28998b44bb3d3cea82c7475c2412f6" alt="Connections list with new connector" width="4362" height="2578" data-path="images/connections list with new connector.webp" />
        </Frame>
      </Step>
    </Steps>

    ### Import into your project

    <Steps>
      <Step title="Open the Import panel">
        From inside your project, click **Import**.

        <Frame>
          <img src="https://mintcdn.com/summation-676748f5-docs-api-and-integrations/zweiW-5lpFAjuEBM/images/import%20button.png?fit=max&auto=format&n=zweiW-5lpFAjuEBM&q=85&s=03e527d398292ee7a3df8443eb1df733" alt="Click on Import" width="2266" height="1580" data-path="images/import button.png" />
        </Frame>
      </Step>

      <Step title="Select data from your connection">
        Choose the tables from your connection that you want to use in this project.

        To see all ingested data, visit the **Data** tab.

        <Frame>
          <img src="https://mintcdn.com/summation-676748f5-docs-api-and-integrations/zweiW-5lpFAjuEBM/images/data%20tab%20showing%20ingested%20data.png?fit=max&auto=format&n=zweiW-5lpFAjuEBM&q=85&s=c2808a4995a05ccce8042871ea511c7b" alt="Data tab showing ingested data" width="1328" height="1251" data-path="images/data tab showing ingested data.png" />
        </Frame>
      </Step>
    </Steps>
  </Tab>
</Tabs>

## Create a report

<Steps>
  <Step title="Click Create then Report">
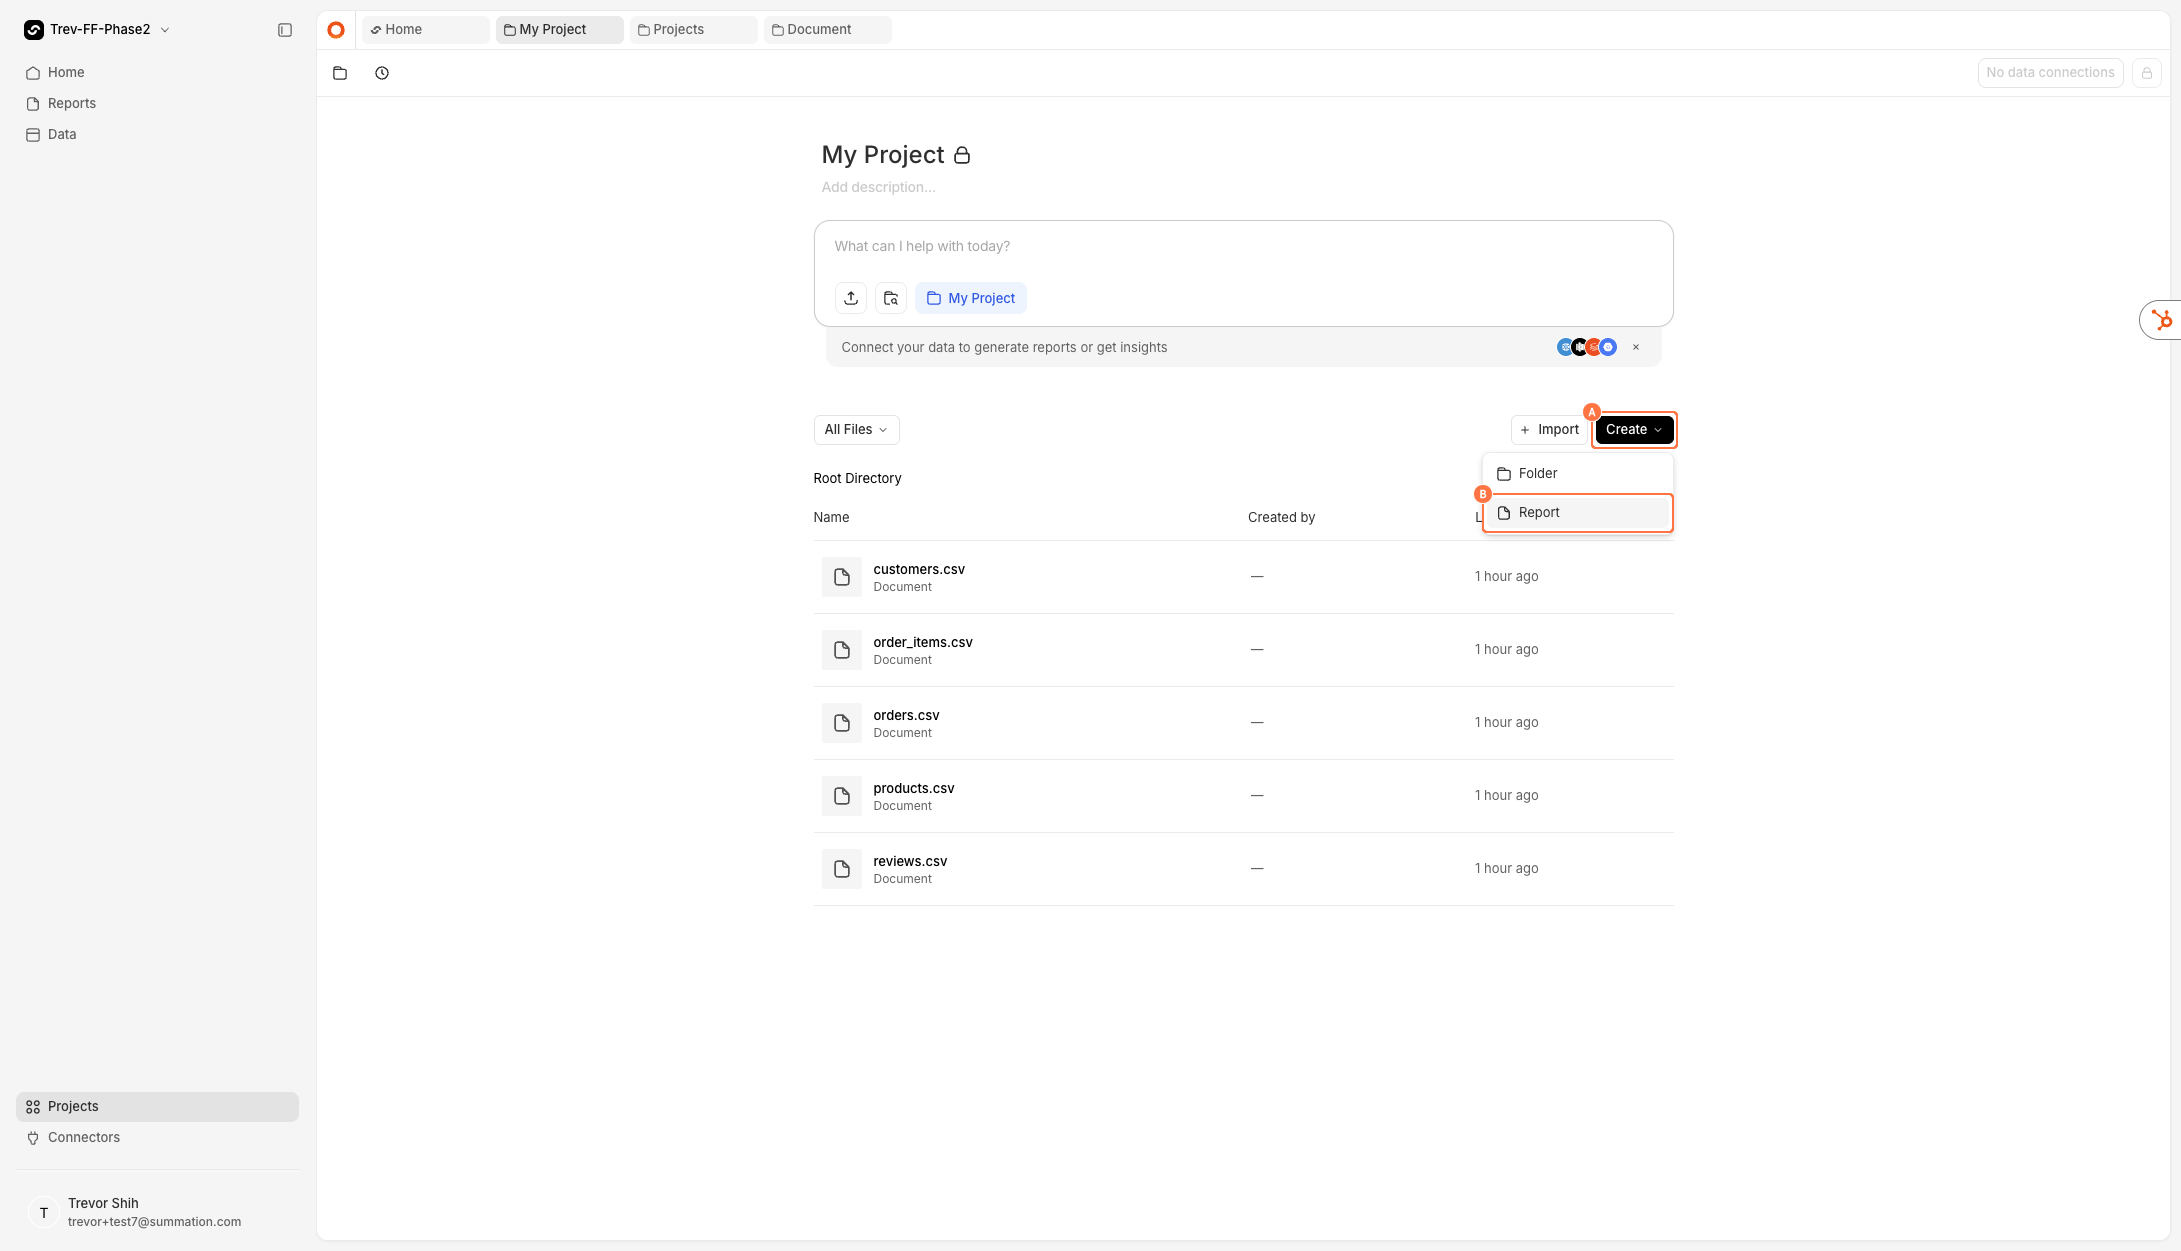
    Click **Create** and select **Report**.
    <Frame>
      <img src="https://mintcdn.com/summation-676748f5-docs-api-and-integrations/zweiW-5lpFAjuEBM/images/create%20%3E%20report%20menu.png?fit=max&auto=format&n=zweiW-5lpFAjuEBM&q=85&s=4d6b319f92f4eaa97356cb8c3452b5bf" alt="Click Create then Report" width="2181" height="1251" data-path="images/create > report menu.png" data-optimize="true" data-opv="3" srcset="https://mintcdn.com/summation-676748f5-docs-api-and-integrations/zweiW-5lpFAjuEBM/images/create%20%3E%20report%20menu.png?w=280&fit=max&auto=format&n=zweiW-5lpFAjuEBM&q=85&s=093d6a61303cd4a5264d07e2207d9778 280w, https://mintcdn.com/summation-676748f5-docs-api-and-integrations/zweiW-5lpFAjuEBM/images/create%20%3E%20report%20menu.png?w=560&fit=max&auto=format&n=zweiW-5lpFAjuEBM&q=85&s=309c89274569ac28a984ea08c817d352 560w, https://mintcdn.com/summation-676748f5-docs-api-and-integrations/zweiW-5lpFAjuEBM/images/create%20%3E%20report%20menu.png?w=840&fit=max&auto=format&n=zweiW-5lpFAjuEBM&q=85&s=3c0c156aea1a7e4b44977b53df82b1cb 840w, https://mintcdn.com/summation-676748f5-docs-api-and-integrations/zweiW-5lpFAjuEBM/images/create%20%3E%20report%20menu.png?w=1100&fit=max&auto=format&n=zweiW-5lpFAjuEBM&q=85&s=7c94cbe6fca8a5cc7bb3e255fff5d563 1100w, https://mintcdn.com/summation-676748f5-docs-api-and-integrations/zweiW-5lpFAjuEBM/images/create%20%3E%20report%20menu.png?w=1650&fit=max&auto=format&n=zweiW-5lpFAjuEBM&q=85&s=7c3b02be604d2792bb54ed218b504745 1650w, https://mintcdn.com/summation-676748f5-docs-api-and-integrations/zweiW-5lpFAjuEBM/images/create%20%3E%20report%20menu.png?w=2500&fit=max&auto=format&n=zweiW-5lpFAjuEBM&q=85&s=e7e37501dfc2b7f17a501a0cbf87065b 2500w" />
    </Frame>
  </Step>

  <Step title="Enter a prompt">
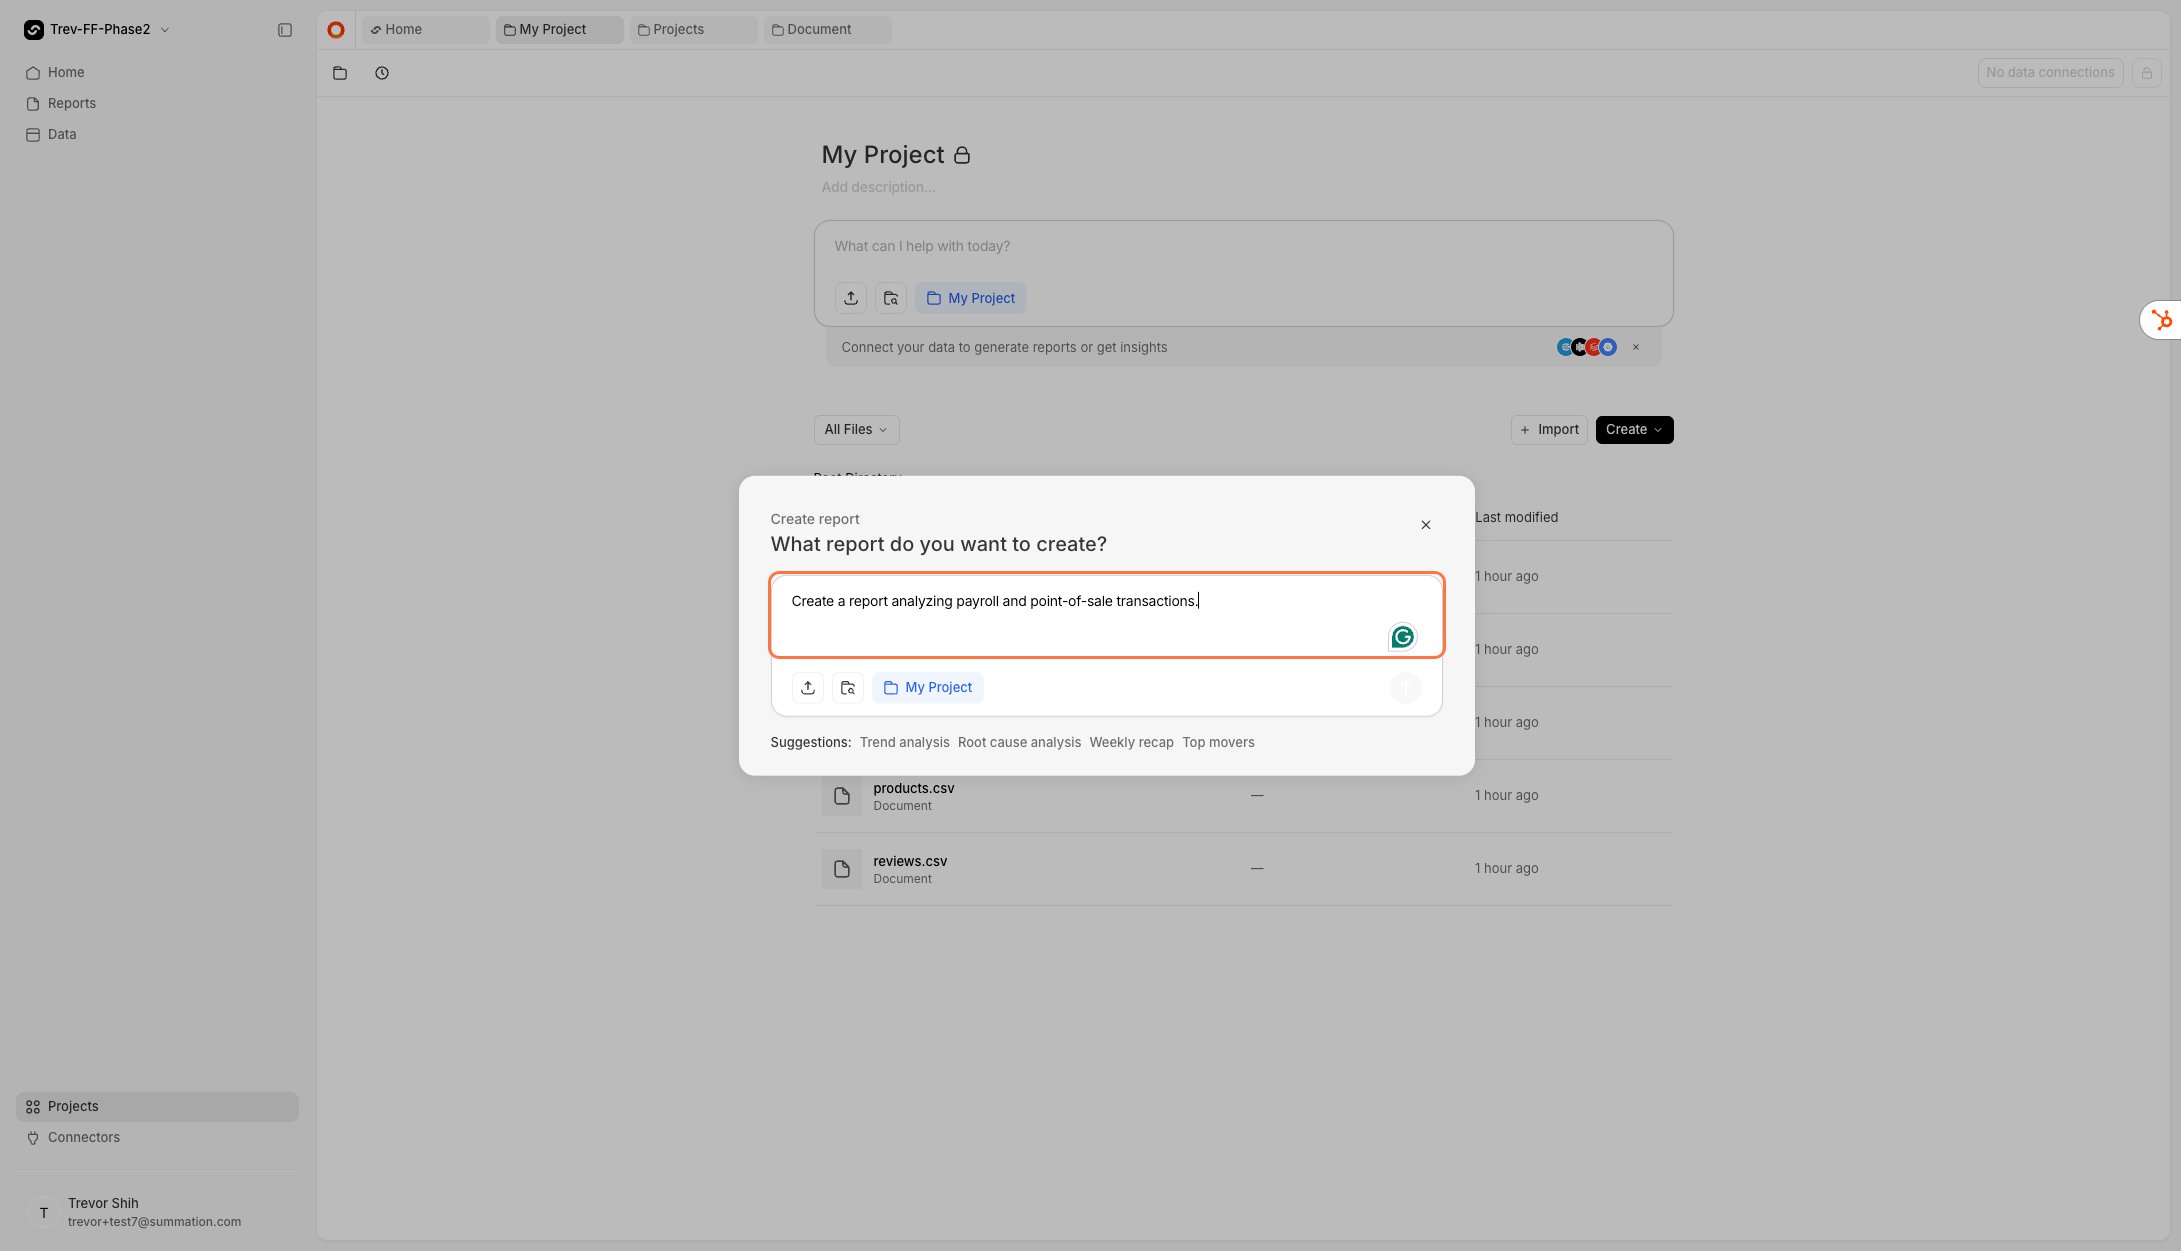
    Describe the analysis you want. Here are some example prompts to try:

    **B2B SaaS data:**

    * "Summarize and analyze the pipeline and conversion funnel"
    * "Create a report analyzing product usage"
    * "QBR: P\&L by segment and geography with variance commentary, highlighting cost drivers, revenue mix shifts, and risk-flagged entries requiring attention"

    **Retail data:**

    * "Analyze inventory movements and point-of-sale transactions"
    * "Store-level P\&L comparison for 2024: revenue by category, shrinkage and inventory loss rates, and labor cost efficiency"

    **Manufacturing data:**

    * "What are the key headlines in partner channel performance?"
    * "Analyze the P\&L for key takeaways"
    <Frame>
      <img src="https://mintcdn.com/summation-676748f5-docs-api-and-integrations/zweiW-5lpFAjuEBM/images/report%20prompt%20input.png?fit=max&auto=format&n=zweiW-5lpFAjuEBM&q=85&s=0fbc8175827427090126a0b17b79555a" alt="Enter a prompt to generate your report" width="2181" height="1251" data-path="images/report prompt input.png" />
    </Frame>
  </Step>

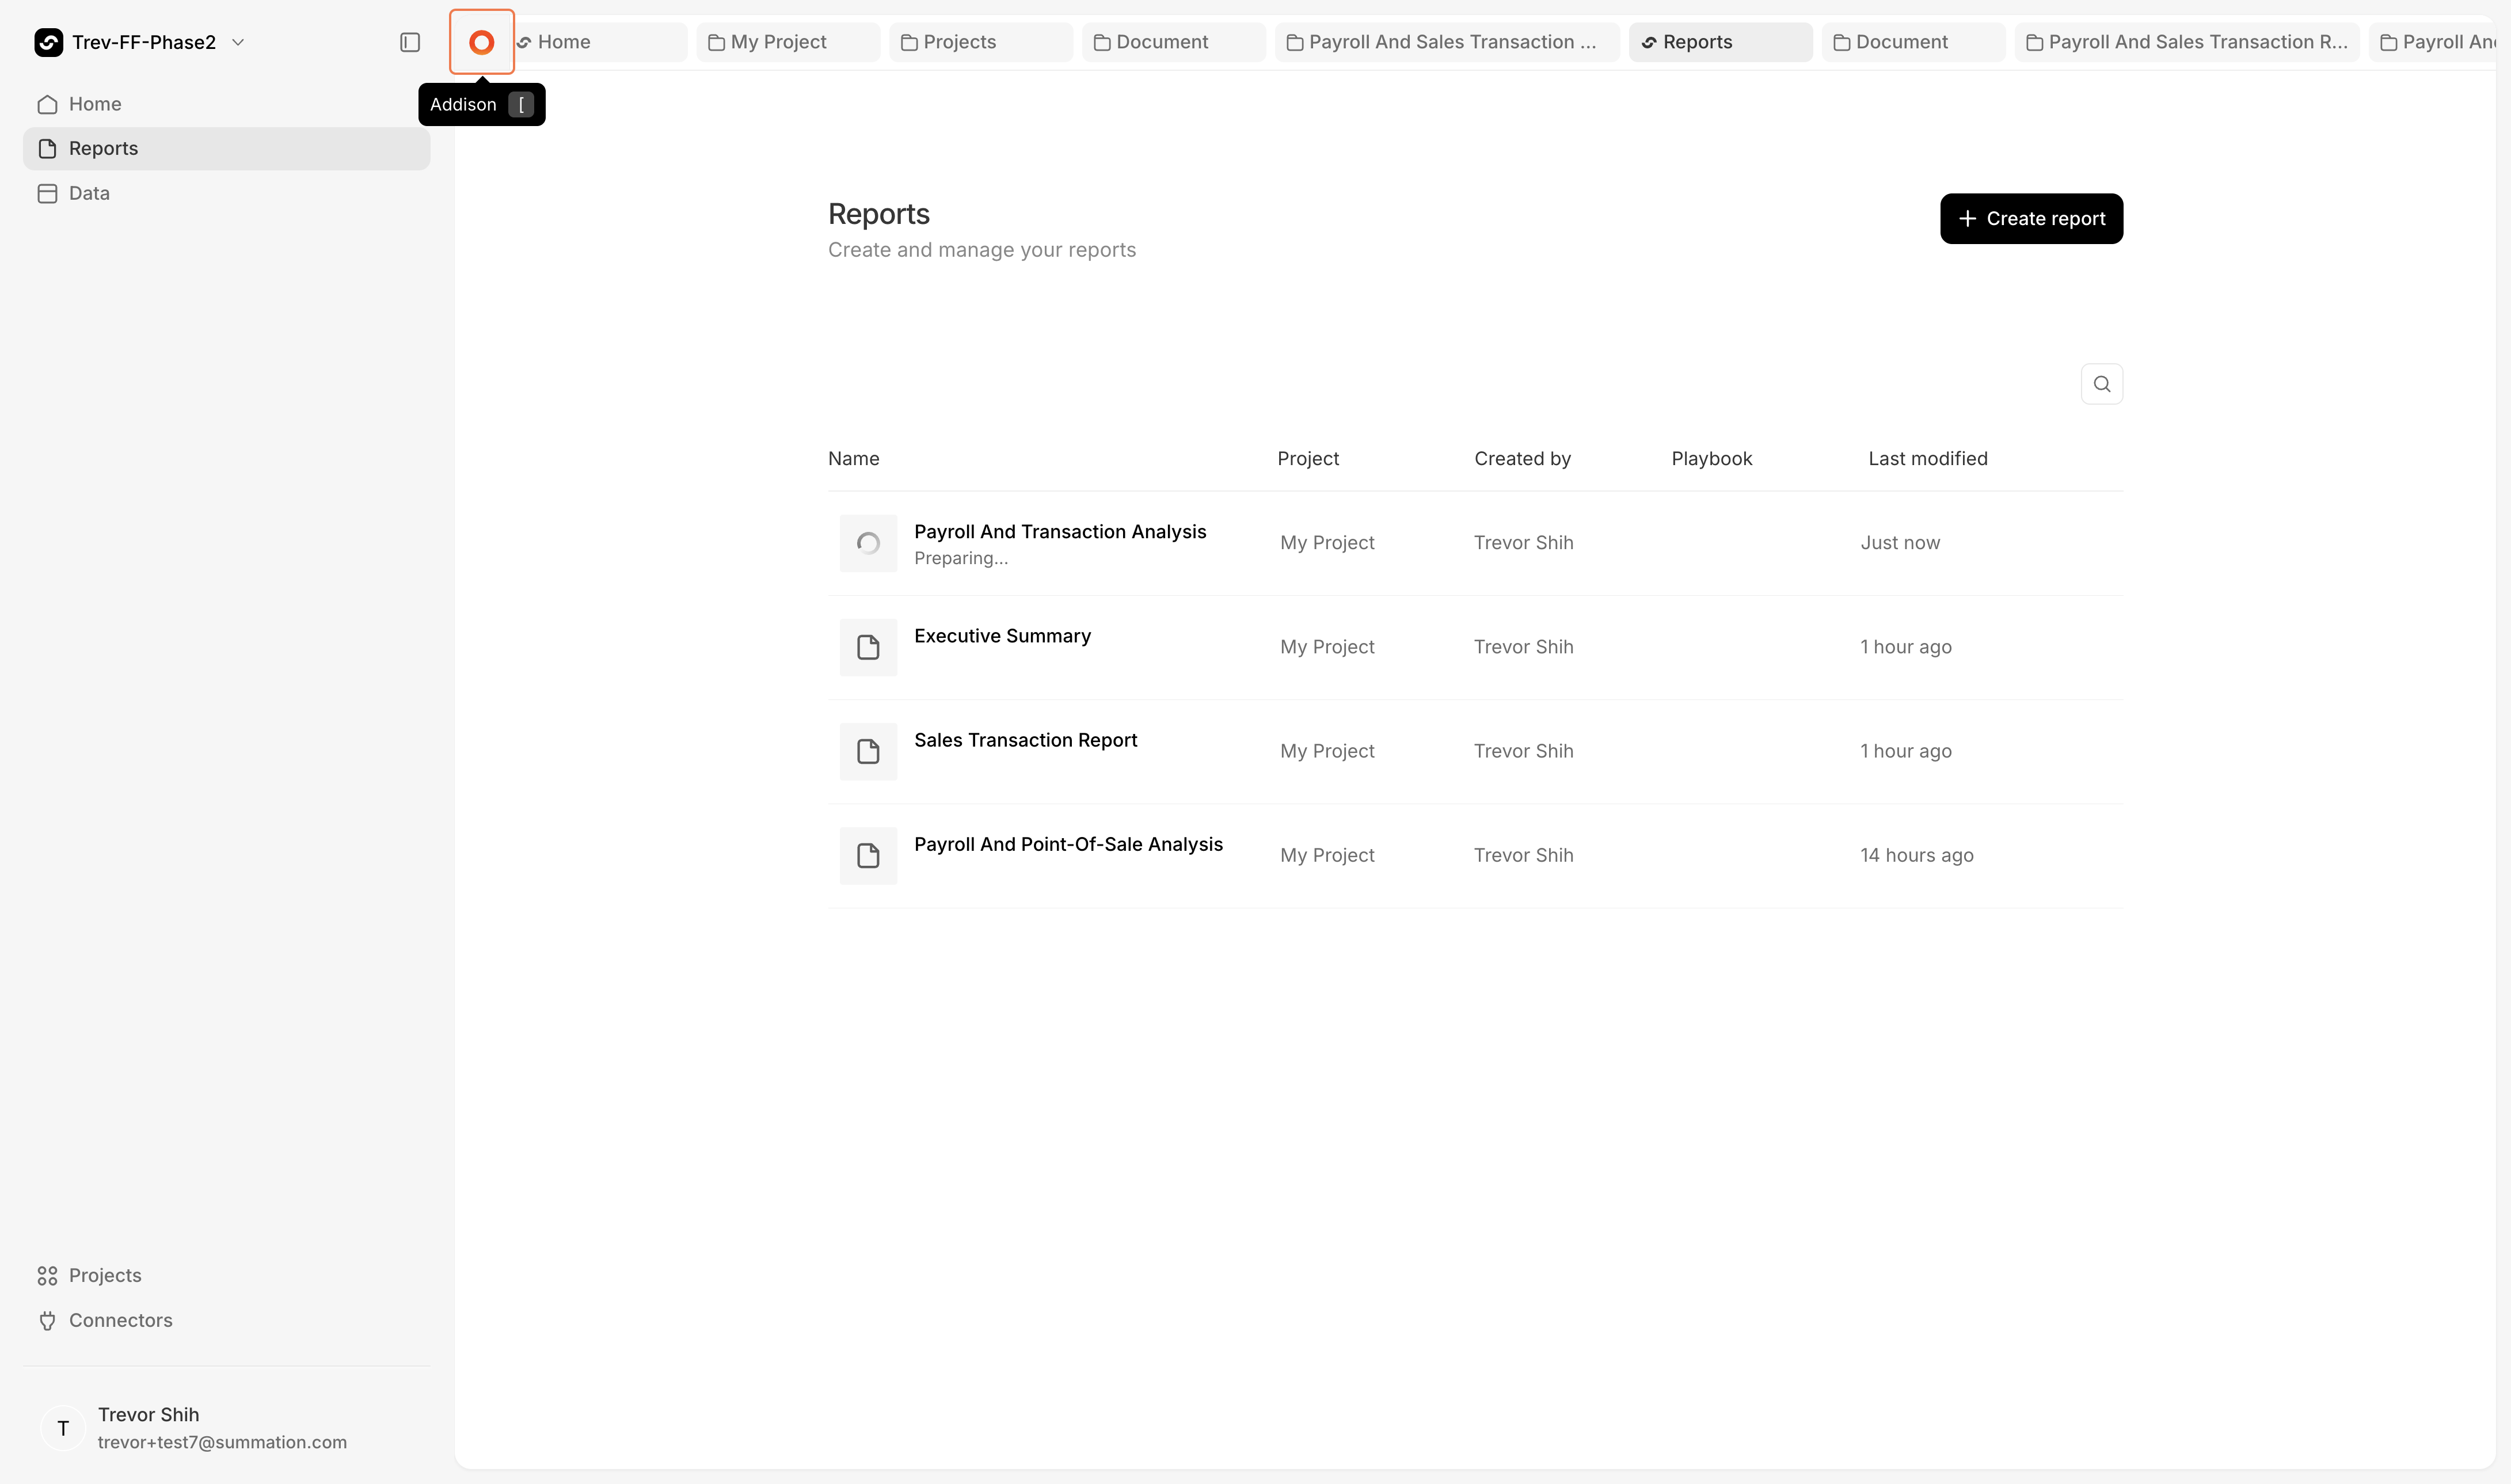
  <Step title="Find your report in the Reports tab">
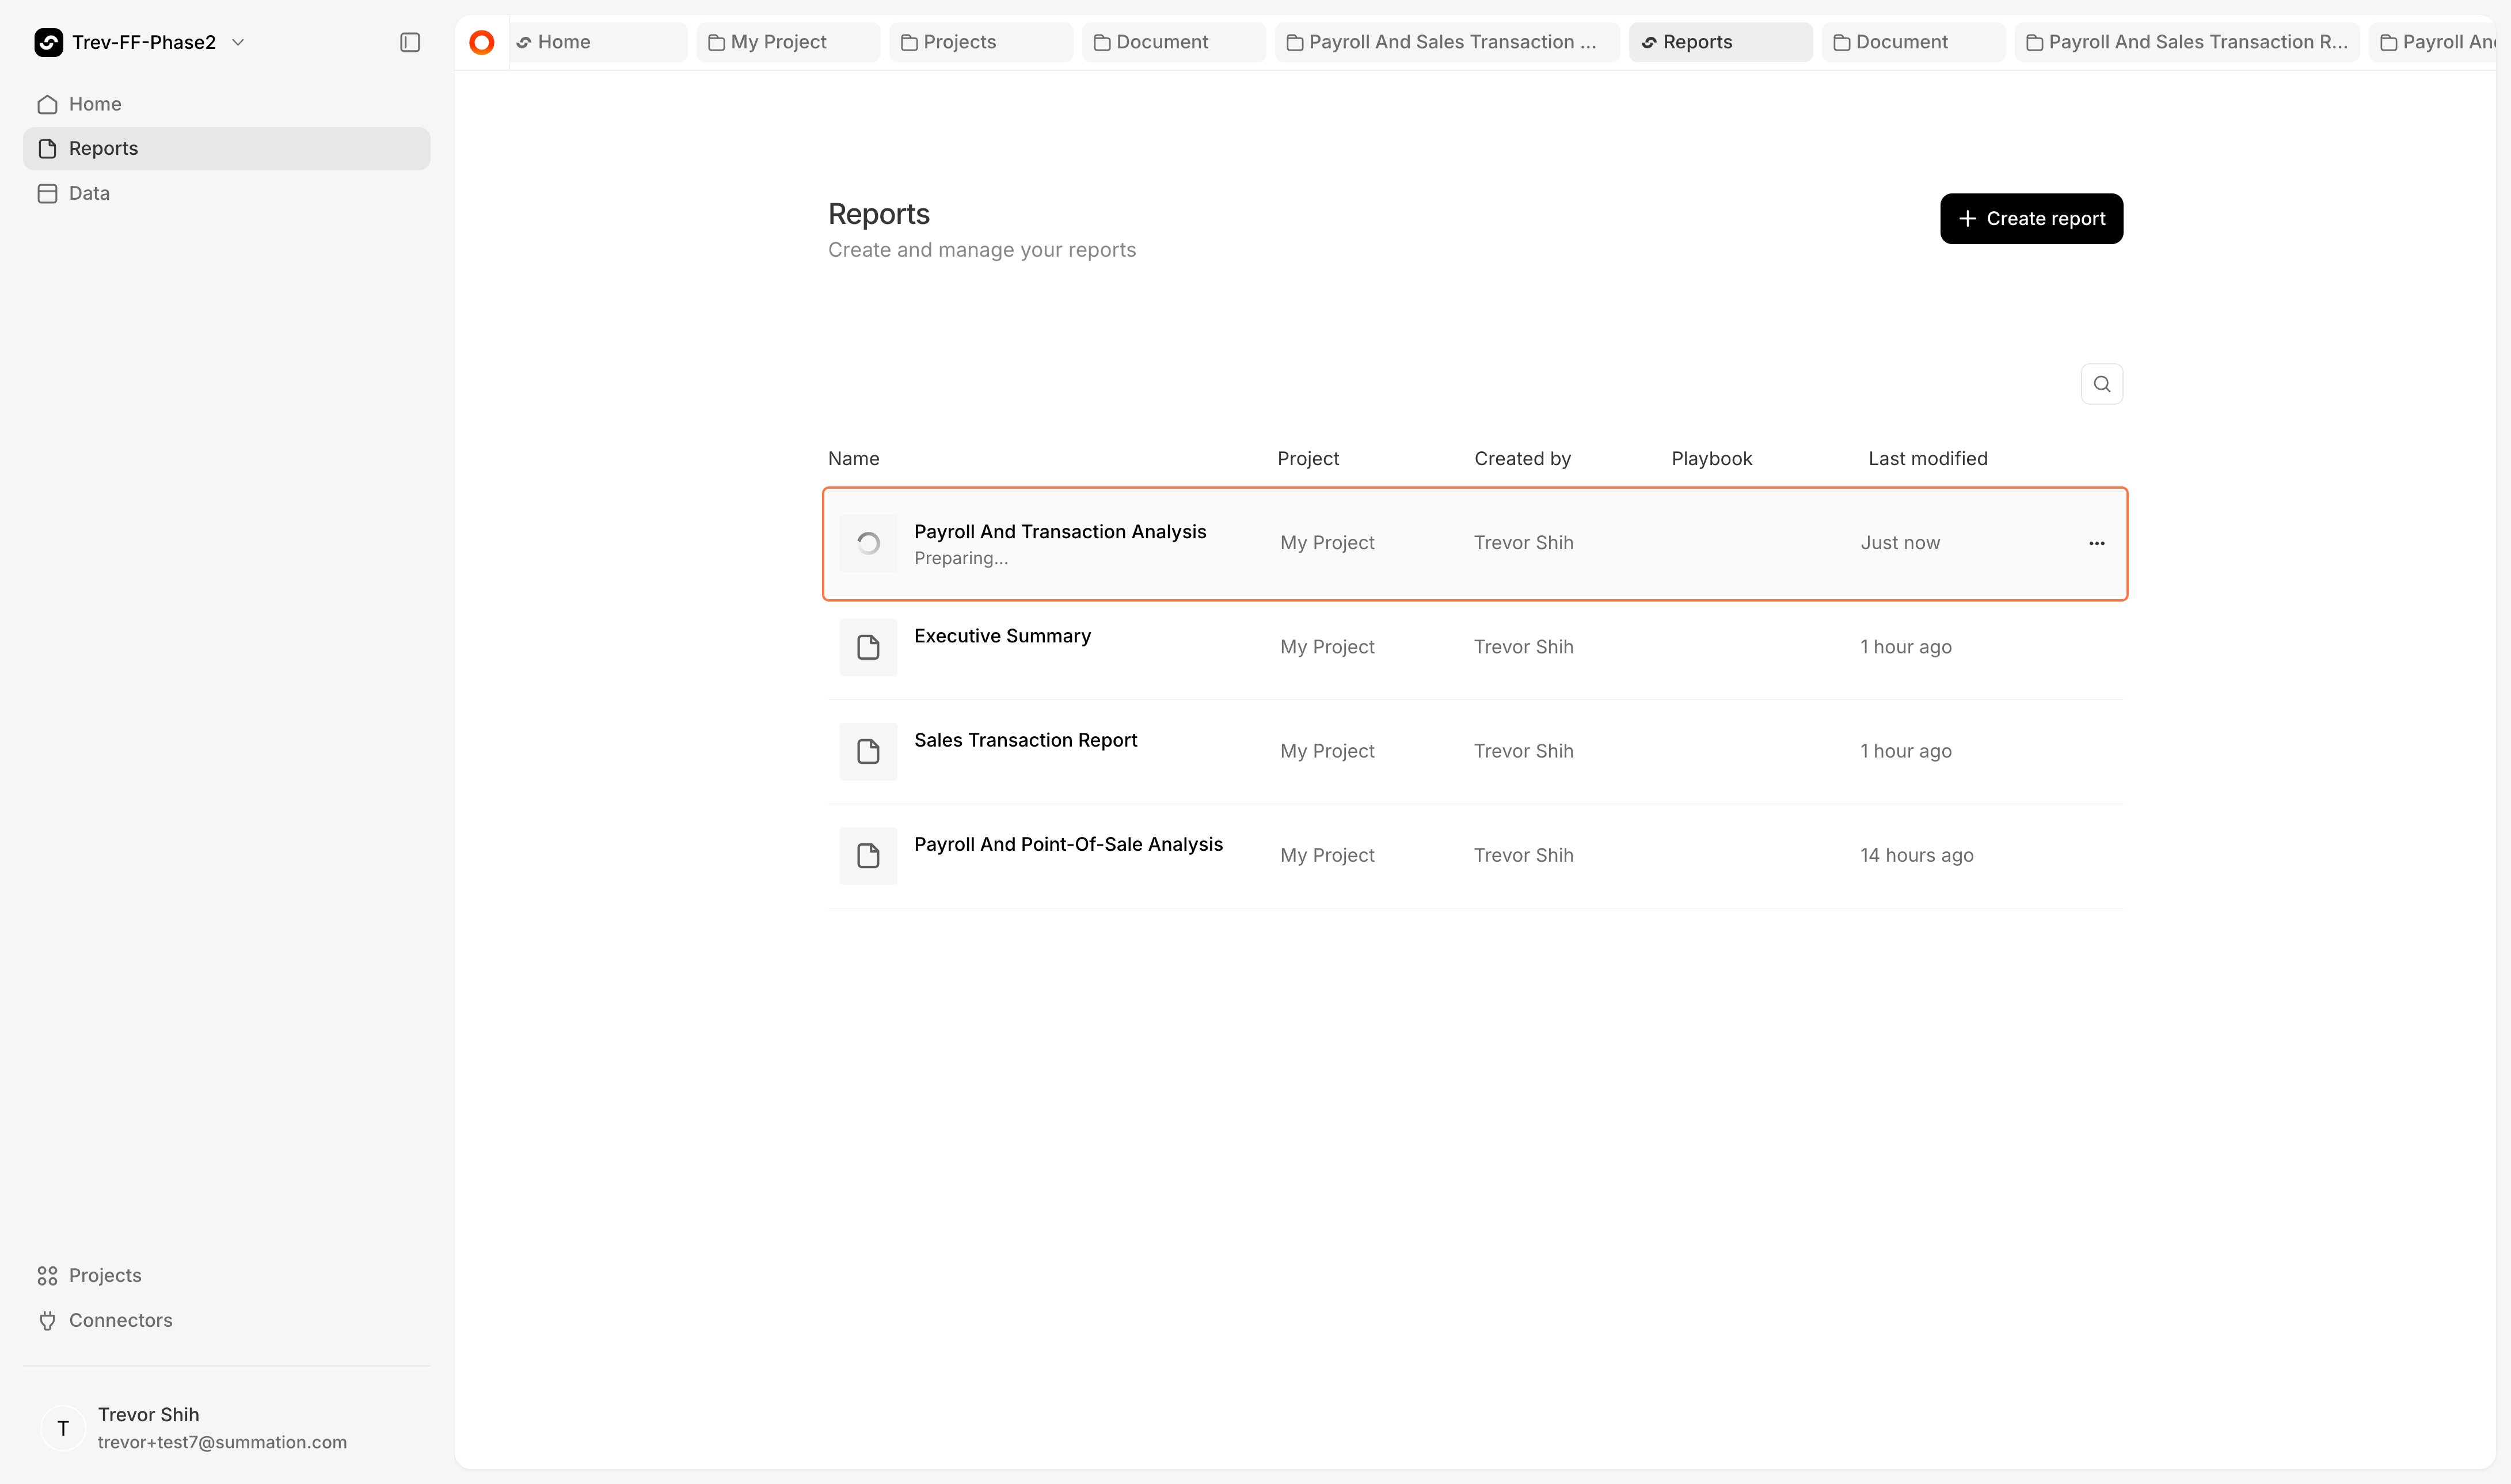
    The **Reports** tab displays all reports you've created and reports shared with you. While building, the report will show "Preparing..."
    <Frame>
      <img src="https://mintcdn.com/summation-676748f5-docs-api-and-integrations/zweiW-5lpFAjuEBM/images/reports%20tab%20with%20report%20in%20preparing%20state.webp?fit=max&auto=format&n=zweiW-5lpFAjuEBM&q=85&s=cd96467435c2bbeba3de68a10393774f" alt="Reports tab with report in Preparing state" width="4362" height="2578" data-path="images/reports tab with report in preparing state.webp" />
    </Frame>
  </Step>
</Steps>

### Watch the report being built

Want to see how Addison is building your report? You can follow along in real time.

<Steps>
  <Step title="Open Addison">
    Click the orange Addison icon.

    <Frame>
      <img src="https://mintcdn.com/summation-676748f5-docs-api-and-integrations/zweiW-5lpFAjuEBM/images/orange%20addison%20icon.png?fit=max&auto=format&n=zweiW-5lpFAjuEBM&q=85&s=74ce7398d686b44e11b1c3d2918bc94a" alt="Click the orange Addison icon" width="4362" height="2578" data-path="images/orange addison icon.png" />
    </Frame>
  </Step>

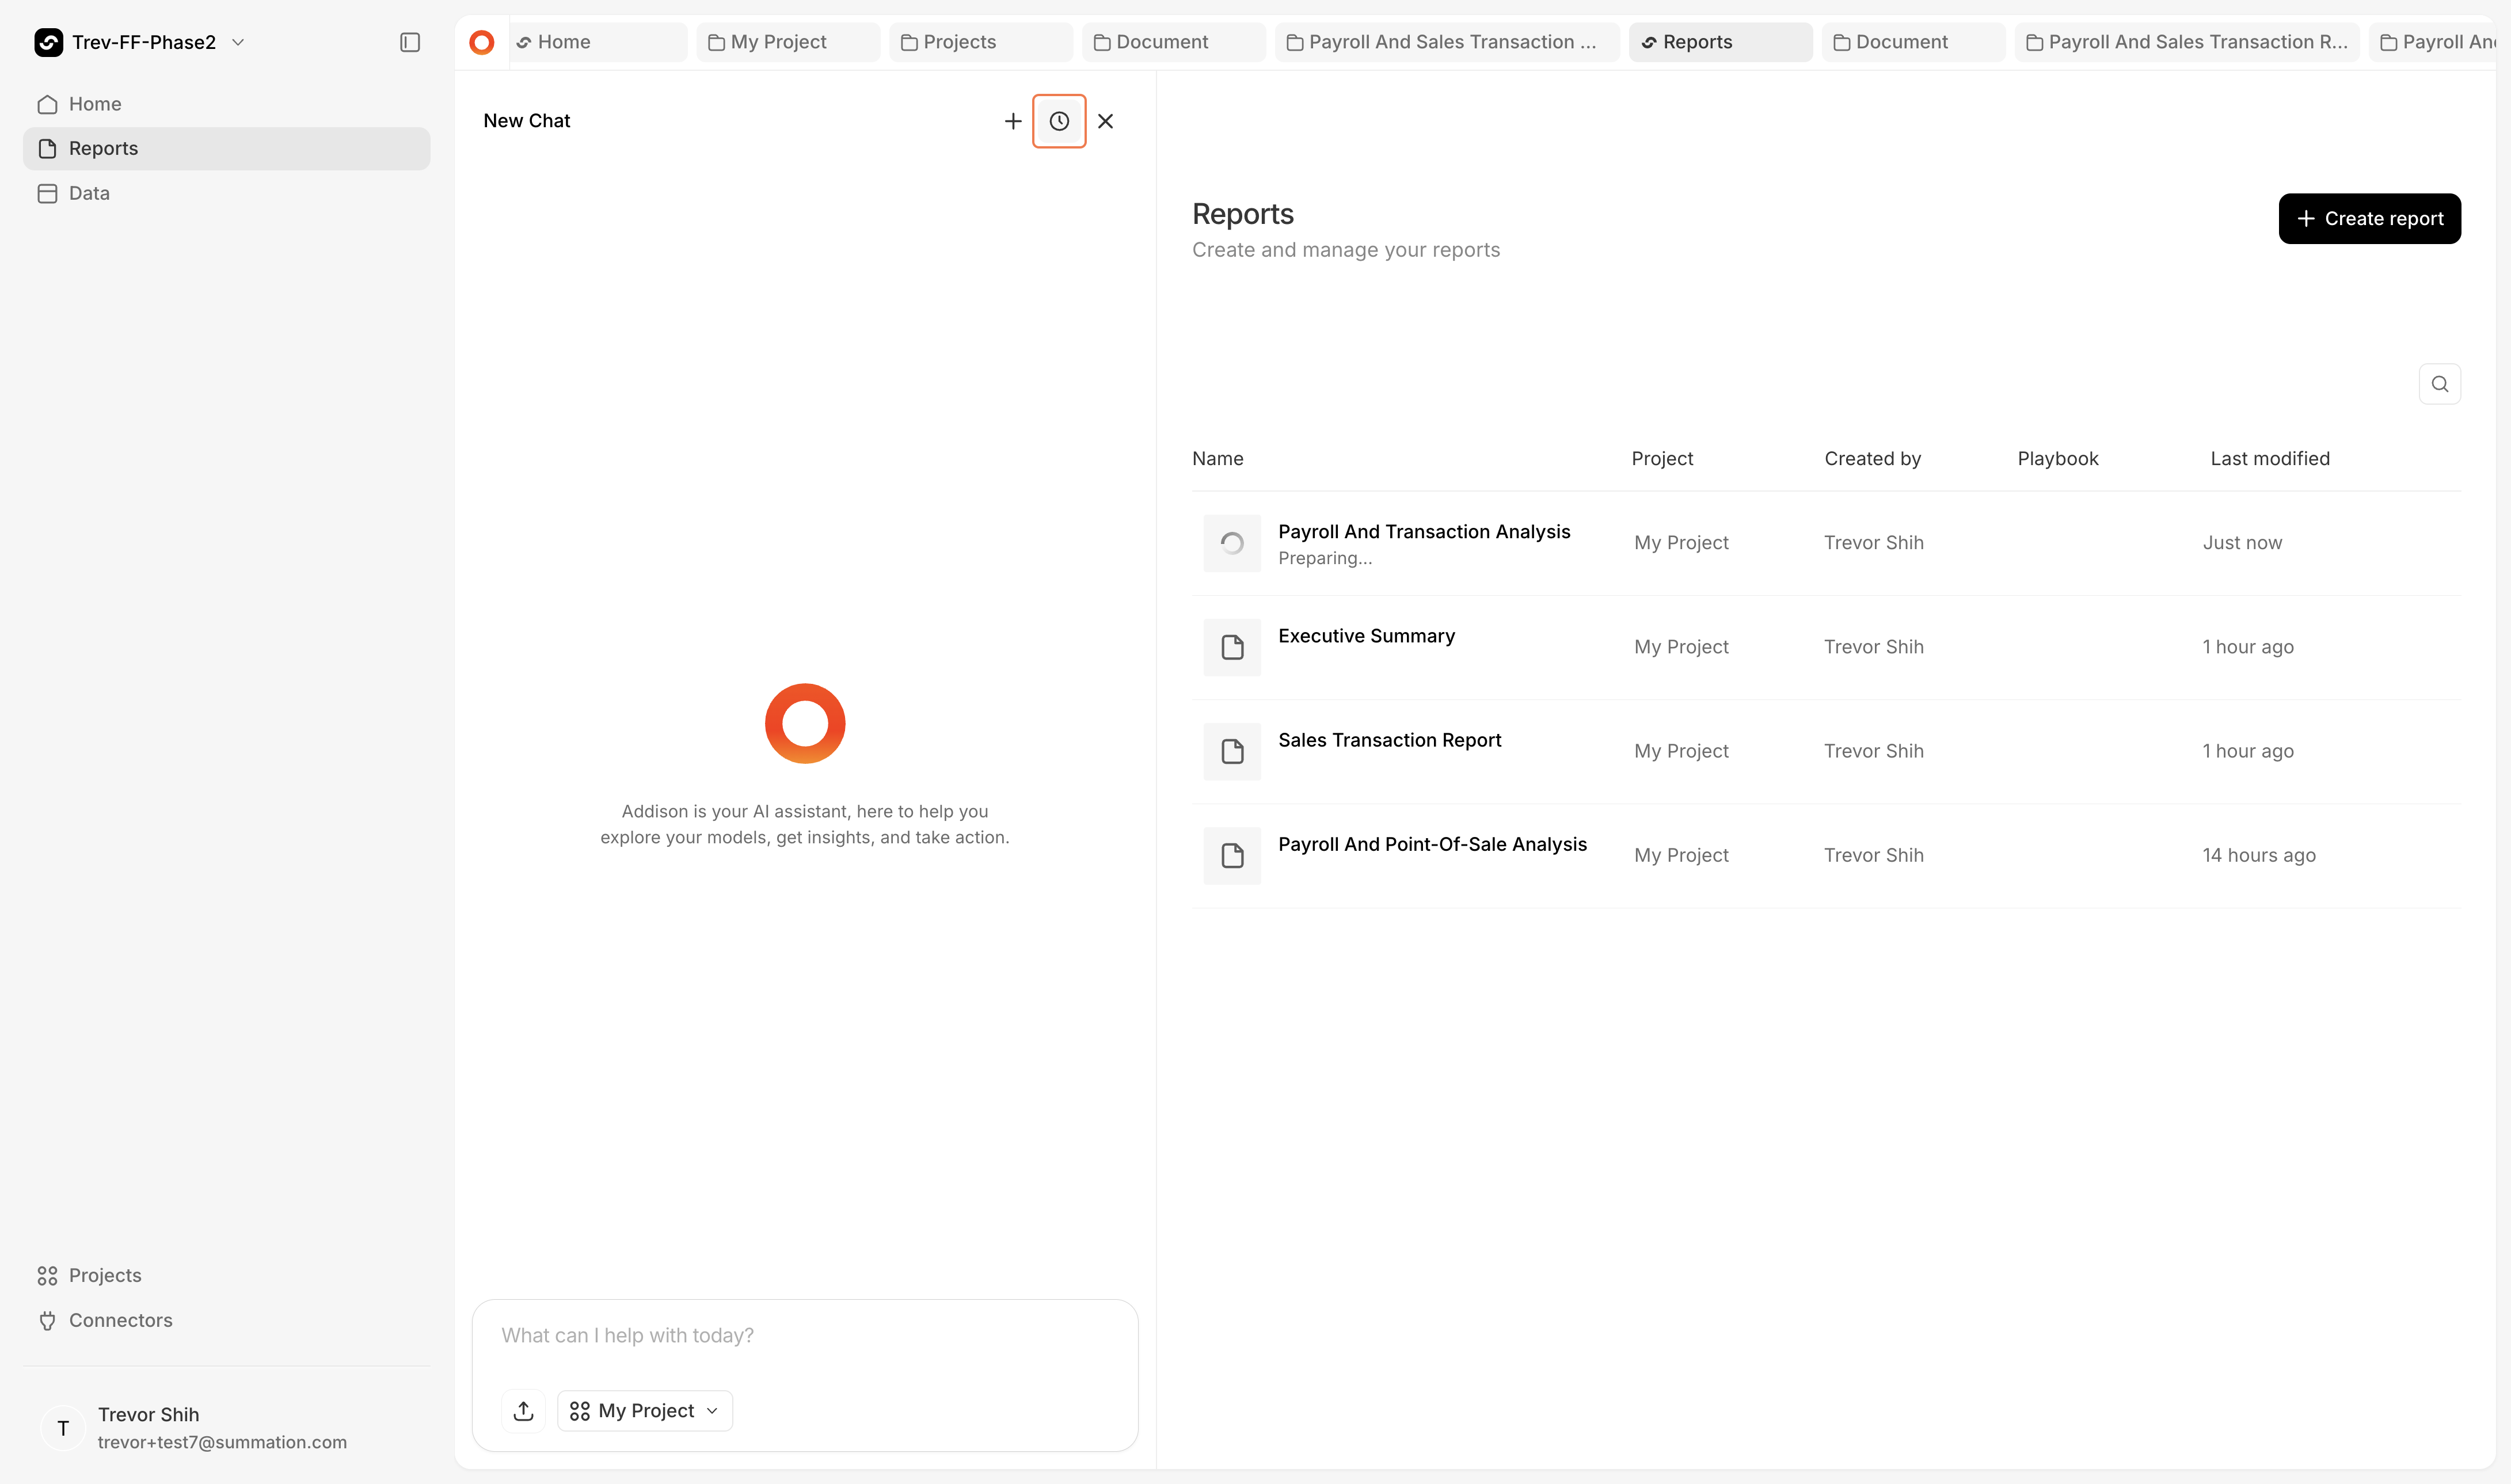
  <Step title="Open chat history">
    Click the clock icon to access chat history.
    <Frame>
      <img src="https://mintcdn.com/summation-676748f5-docs-api-and-integrations/zweiW-5lpFAjuEBM/images/chat%20history.png?fit=max&auto=format&n=zweiW-5lpFAjuEBM&q=85&s=a73532e87568ea2a9a79c3512e8c2c3a" alt="Click the clock icon for chat history" width="4362" height="2578" data-path="images/chat history.png" />
    </Frame>
  </Step>

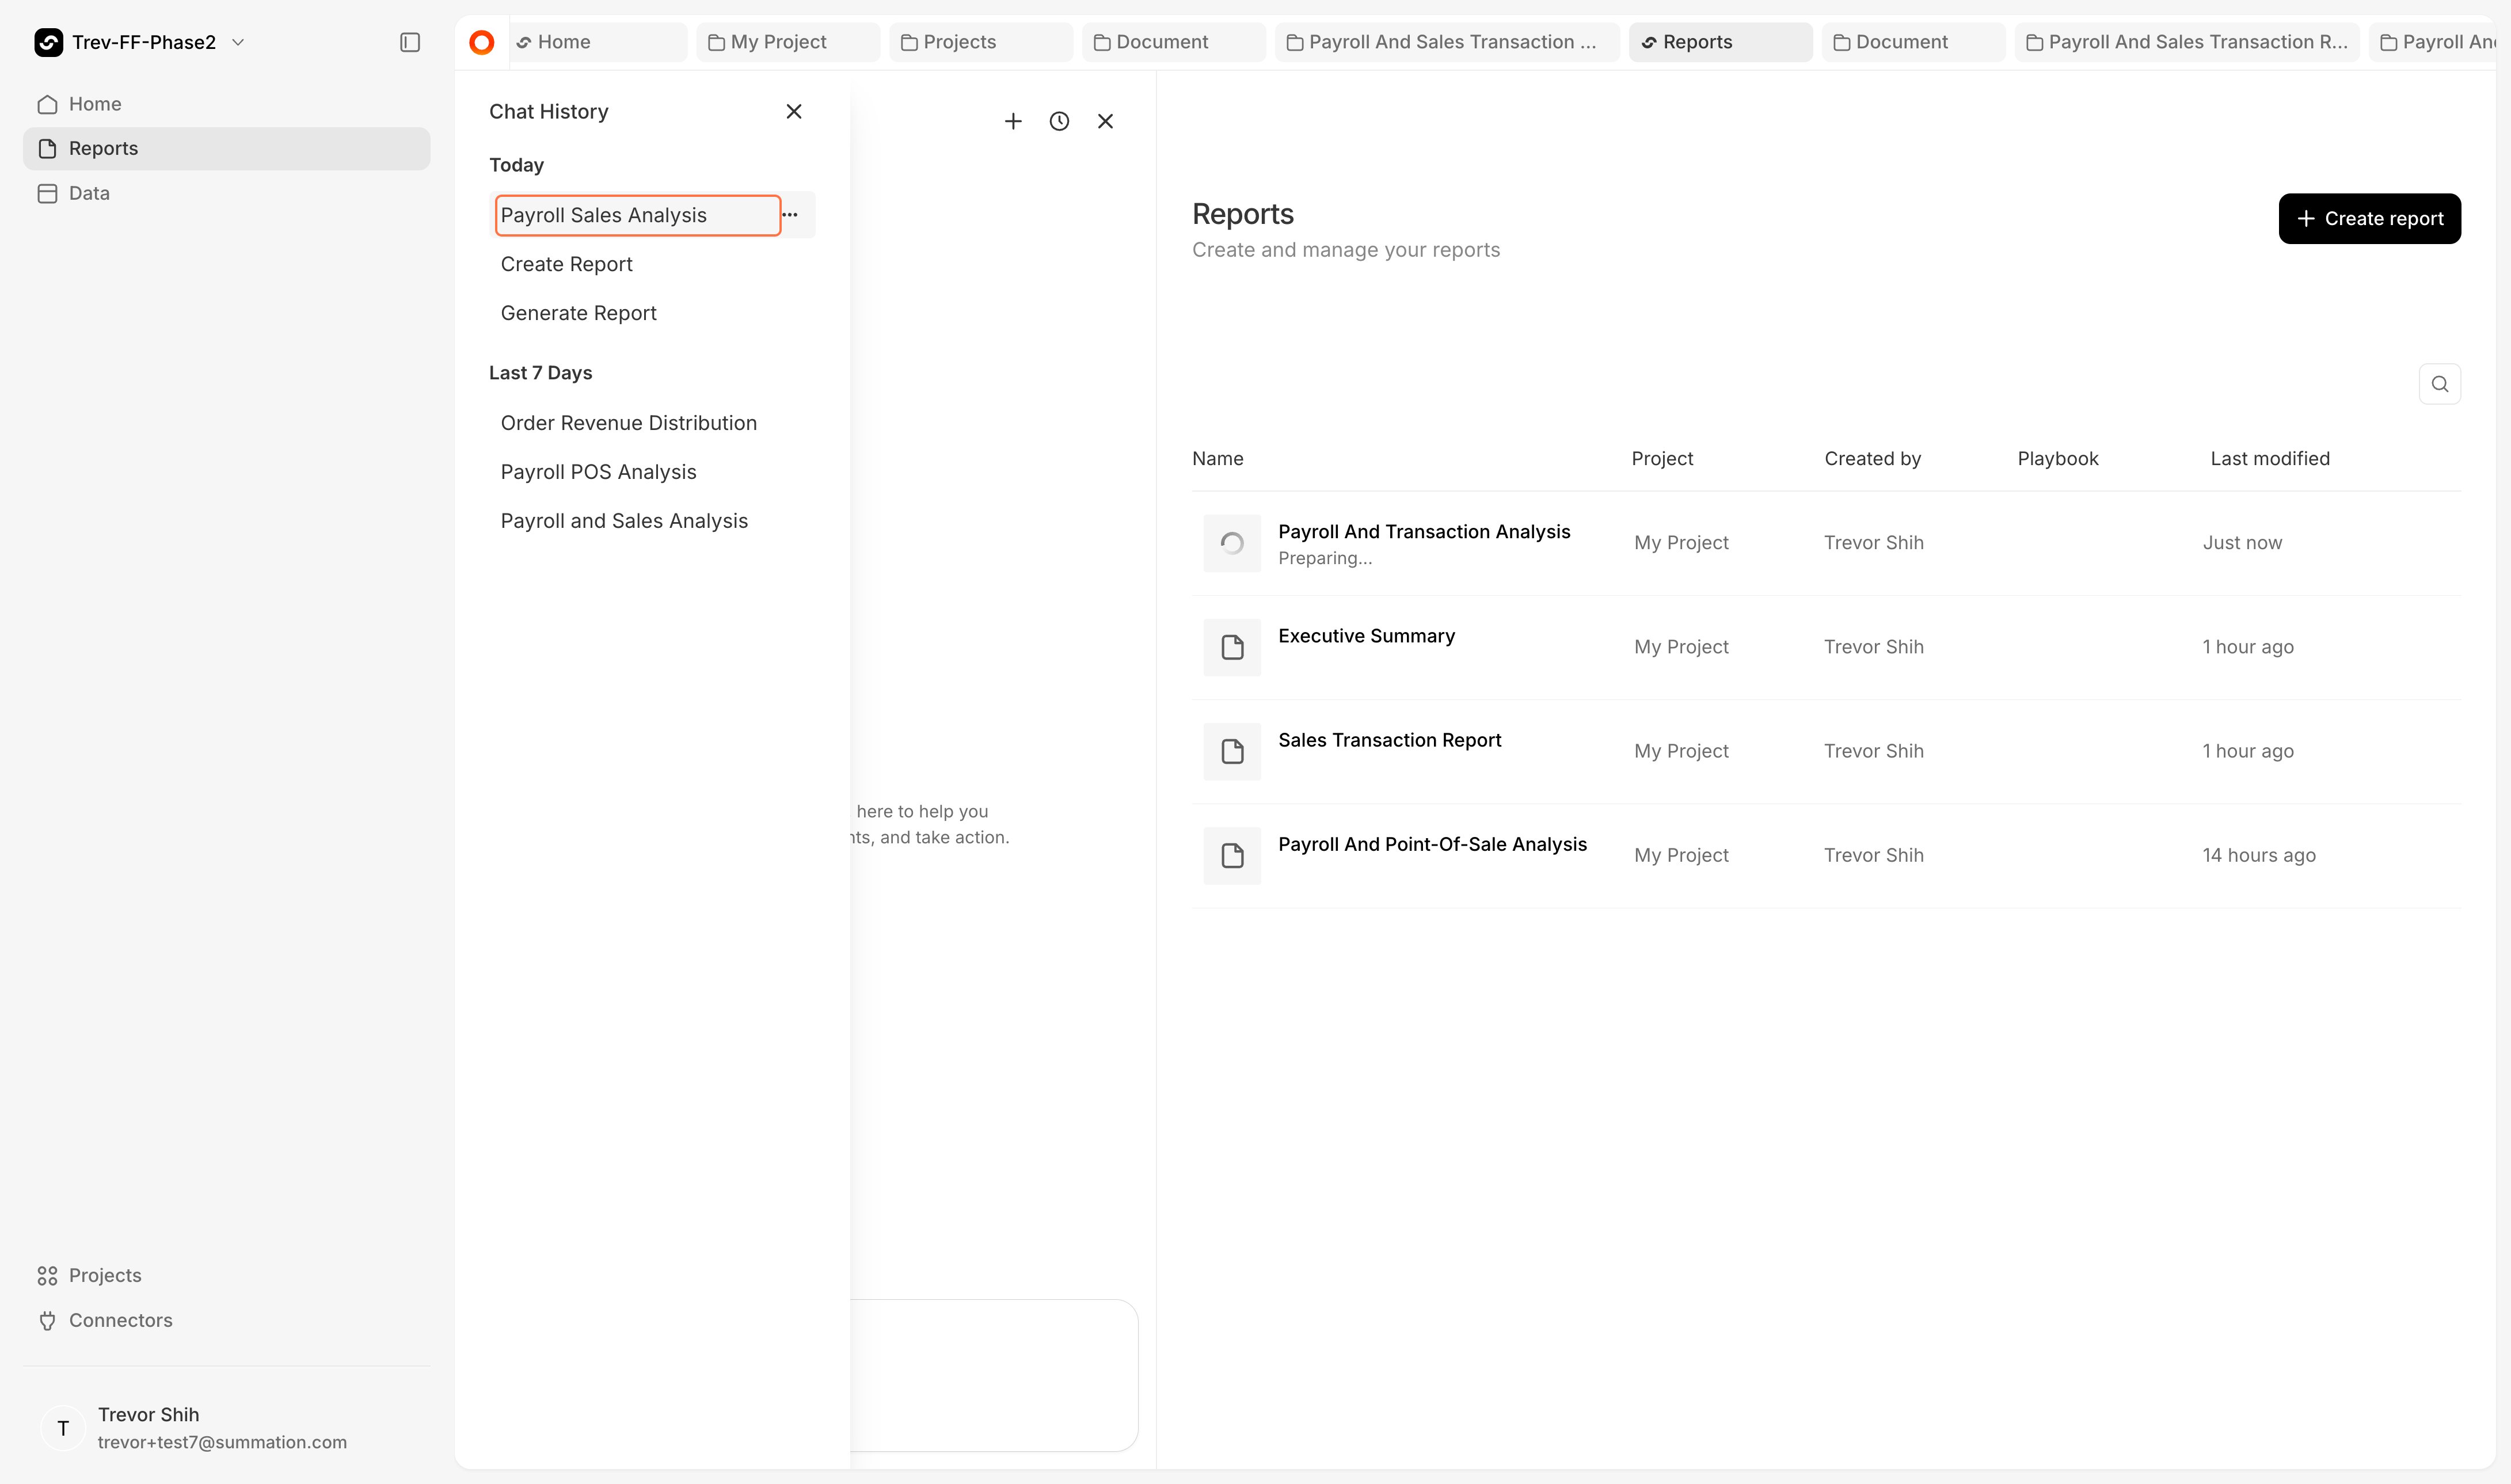
  <Step title="Find the report thread">
    The report you created will appear as the most recent thread.
    <Frame>
      <img src="https://mintcdn.com/summation-676748f5-docs-api-and-integrations/zweiW-5lpFAjuEBM/images/chat%20history%20with%20report%20thread.webp?fit=max&auto=format&n=zweiW-5lpFAjuEBM&q=85&s=354c78368f806b7d3b683a95efedb558" alt="Report appears as the most recent thread" width="4362" height="2578" data-path="images/chat history with report thread.webp" />
    </Frame>
  </Step>

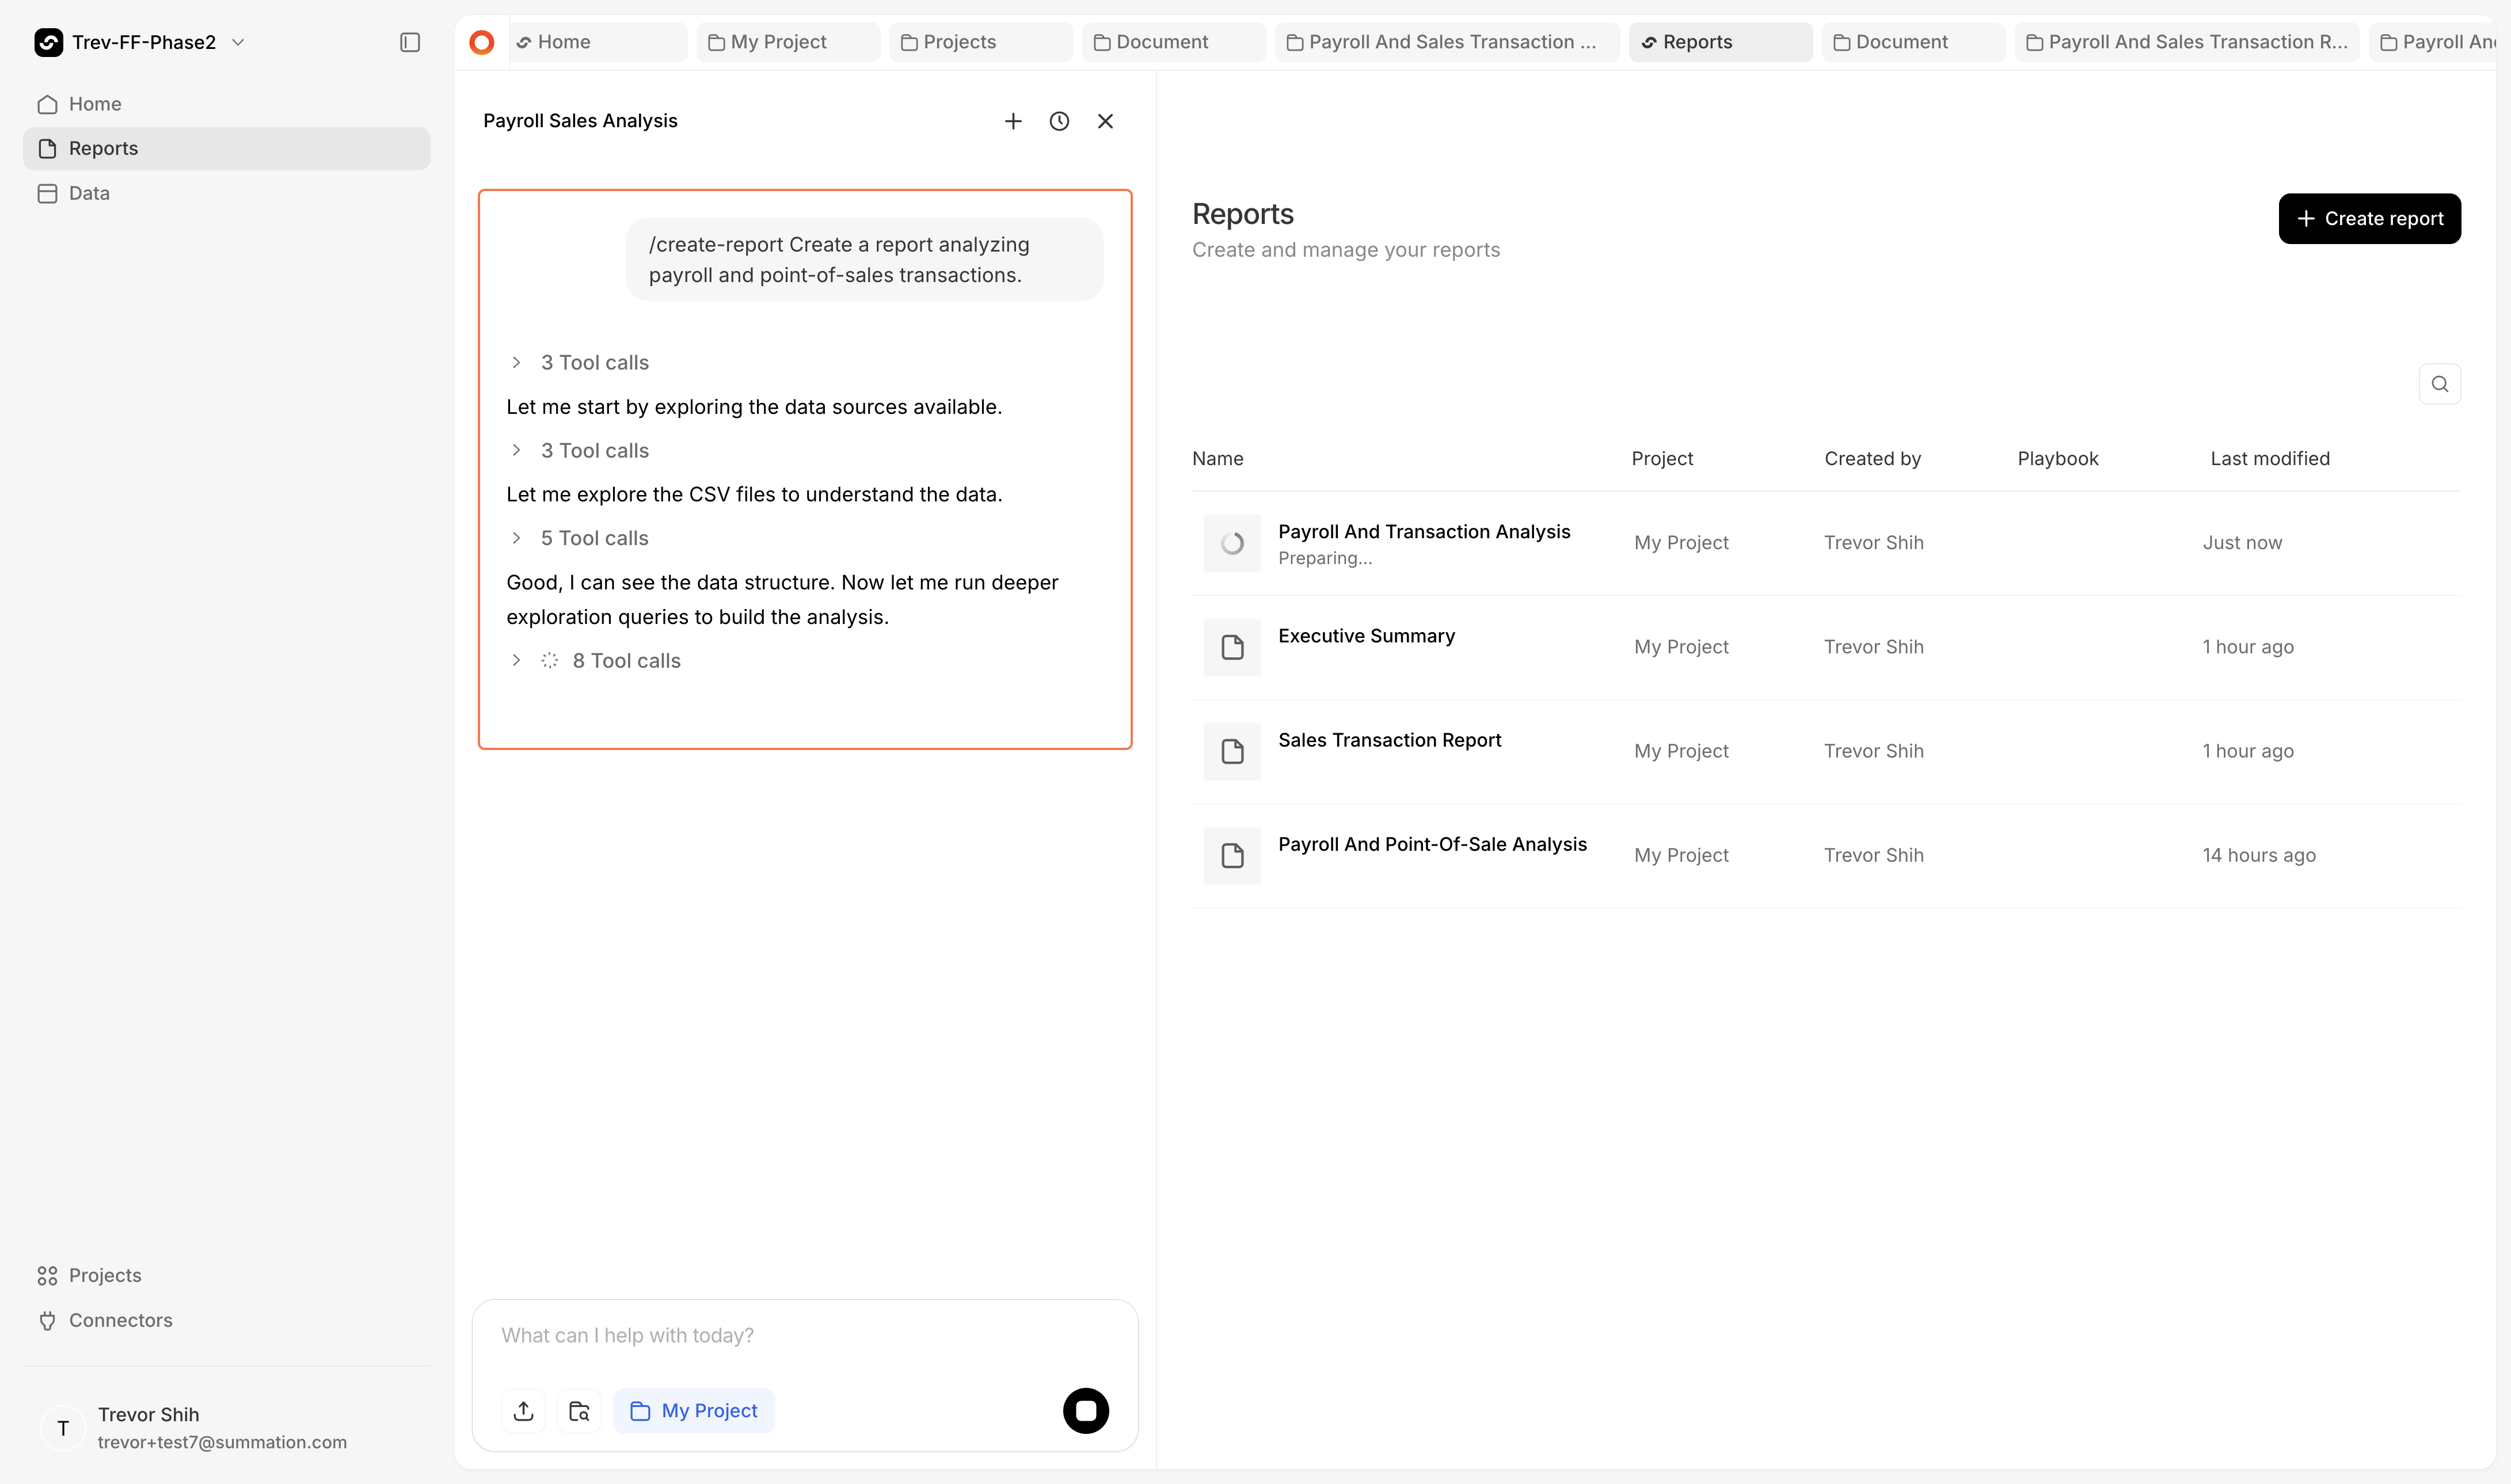
  <Step title="See Addison's reasoning">
    Addison provides an explanation of how it's creating your report — the SQL it's writing, the data it's pulling, and the analysis it's performing.
    <Frame>
      <img src="https://mintcdn.com/summation-676748f5-docs-api-and-integrations/zweiW-5lpFAjuEBM/images/addison%20explaining%20report%20creation%20process.png?fit=max&auto=format&n=zweiW-5lpFAjuEBM&q=85&s=0fd56107d89332be5046ab6fd3312bea" alt="Addison explains how it creates your report" width="4362" height="2578" data-path="images/addison explaining report creation process.png" />
    </Frame>
  </Step>
</Steps>

<Note>
  Report generation takes approximately 5–15 minutes depending on complexity.
</Note>

## Verification

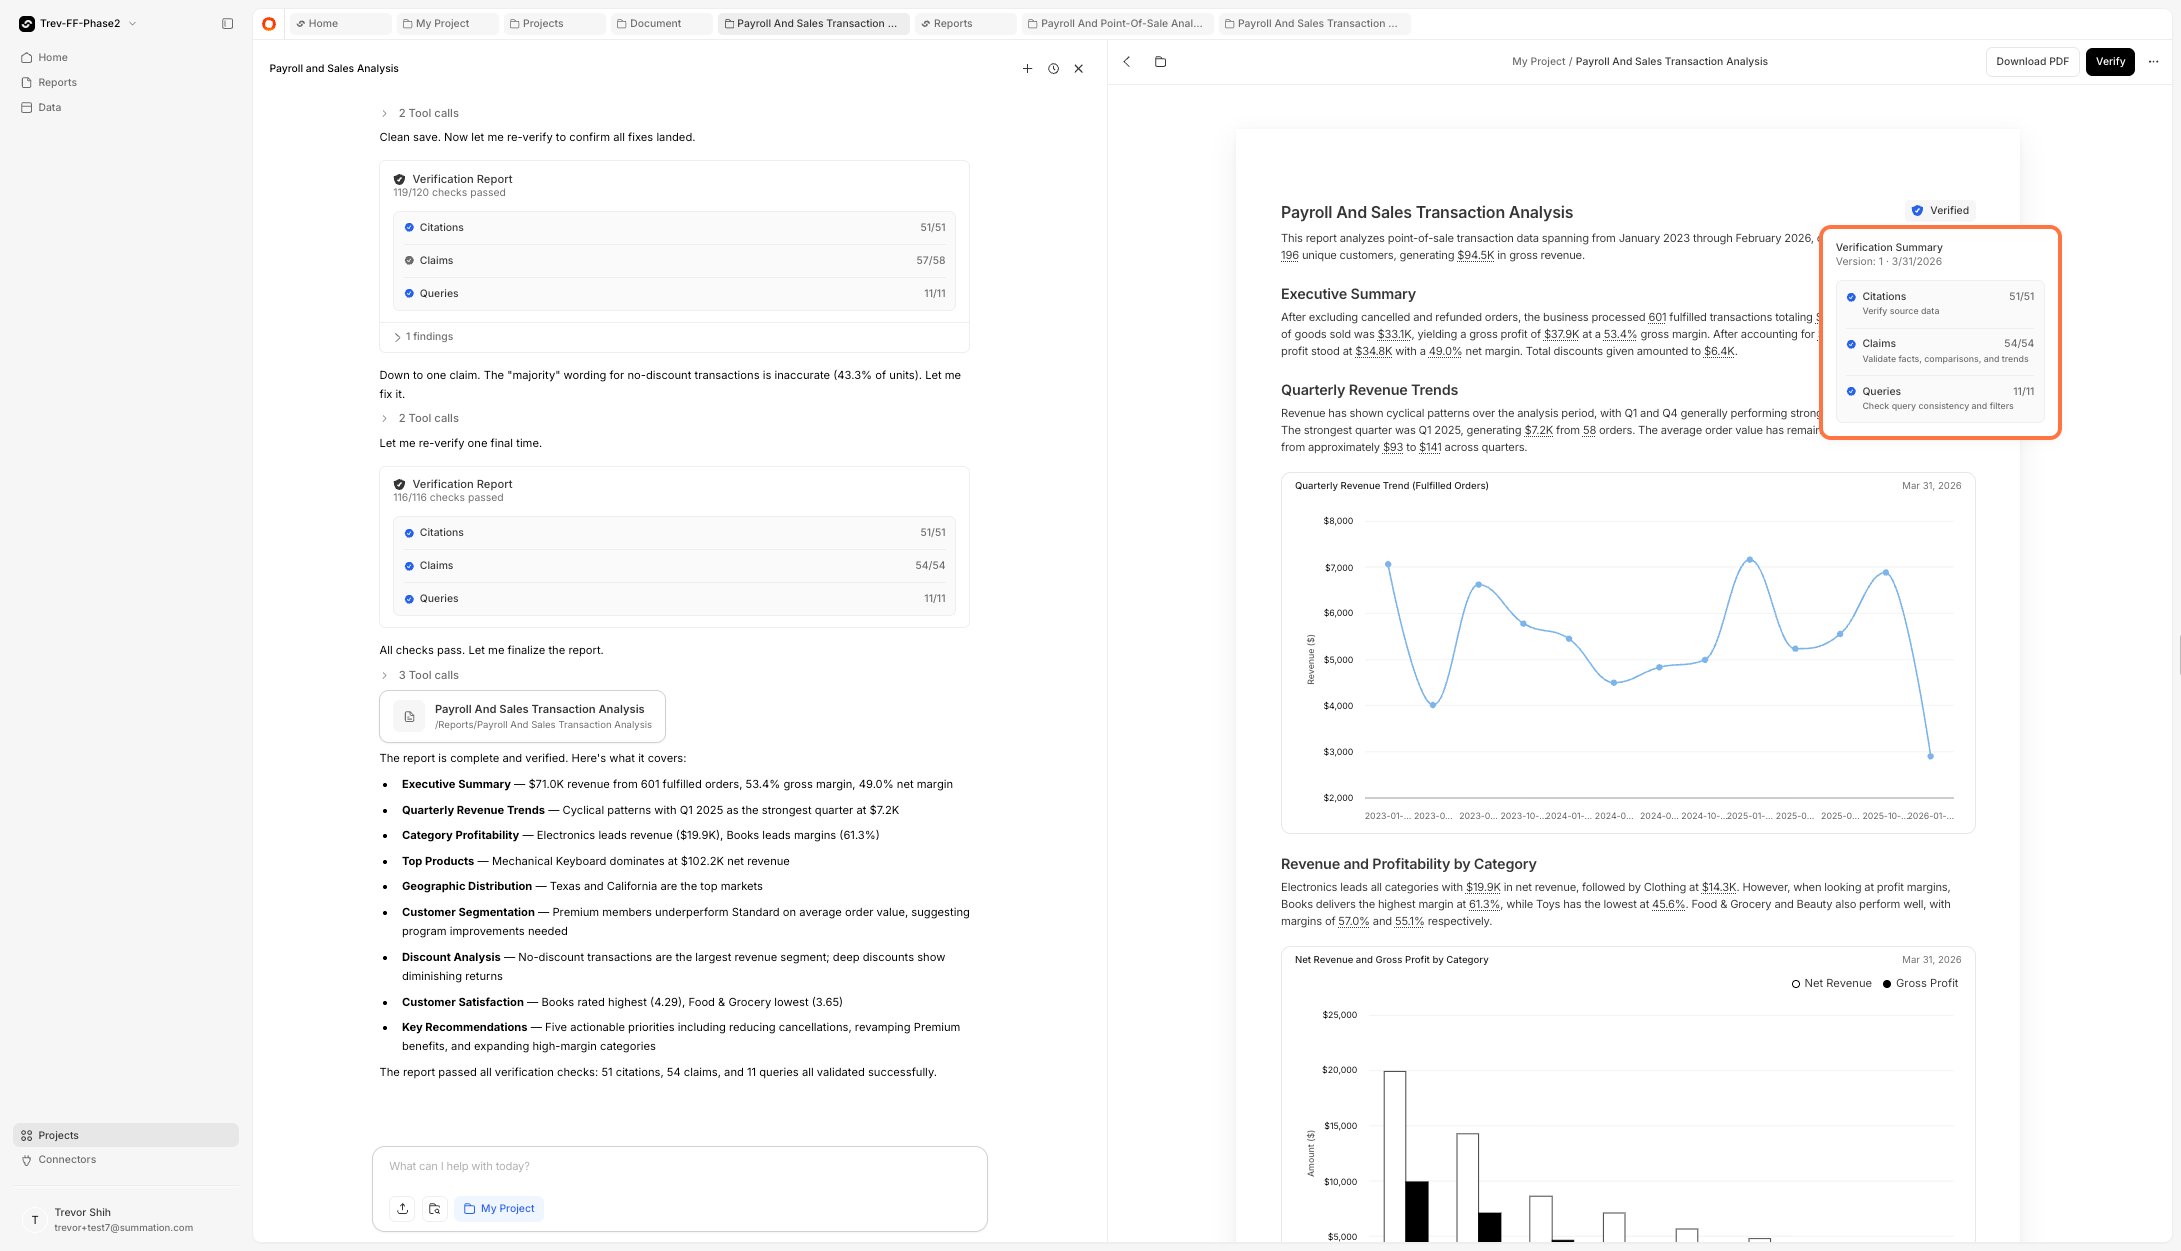
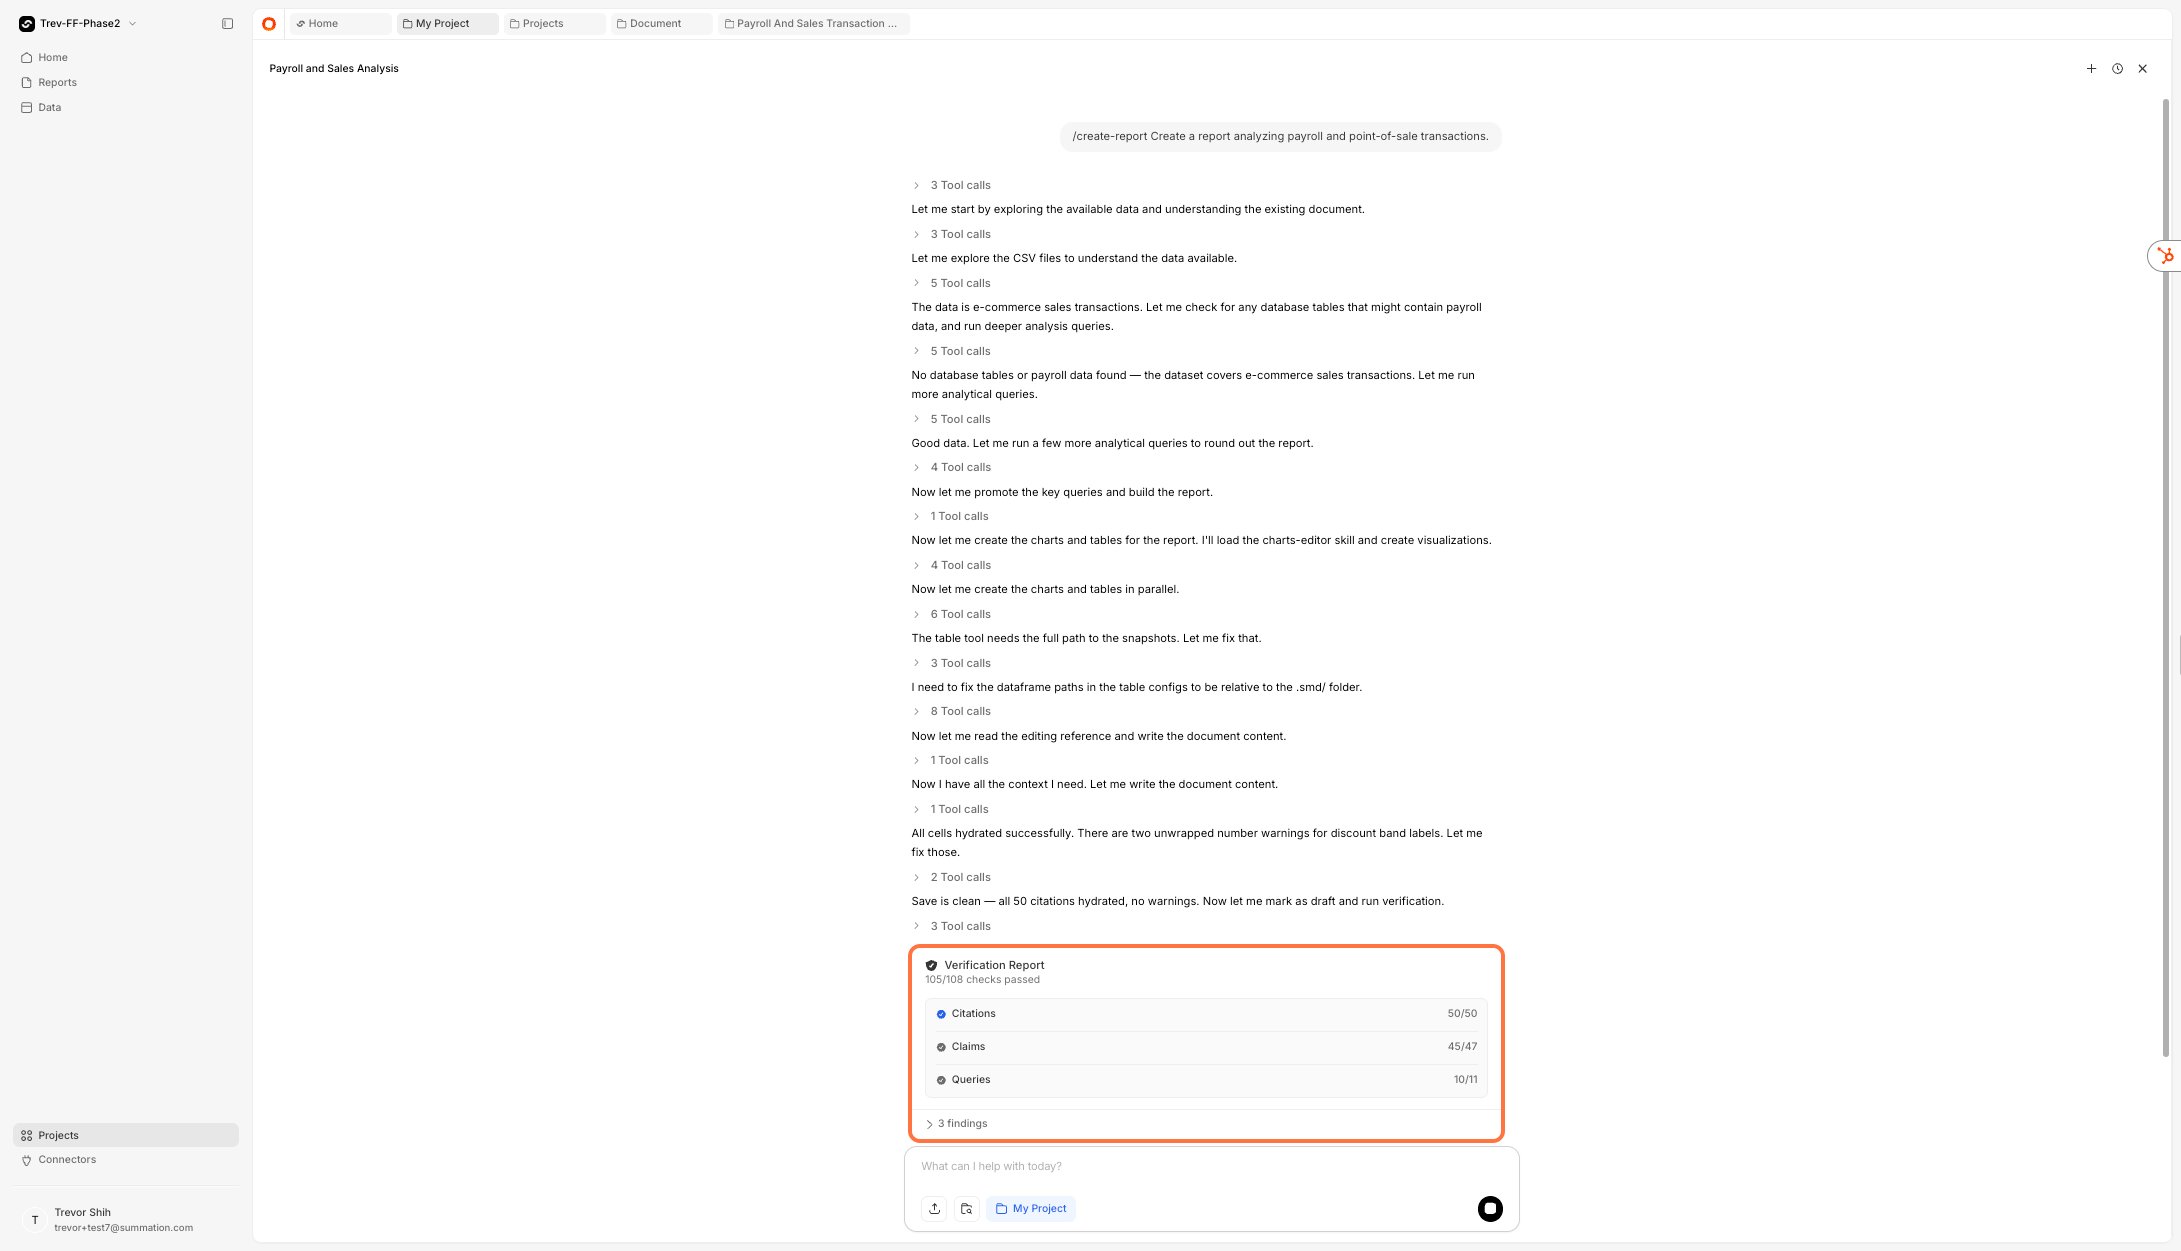
By default, Addison runs a verification process on your report. Verification checks the accuracy of citations, queries, and claims — and highlights any issues it uncovers.
<Frame>
  <img src="https://mintcdn.com/summation-676748f5-docs-api-and-integrations/zweiW-5lpFAjuEBM/images/verification%20in%20chat.png?fit=max&auto=format&n=zweiW-5lpFAjuEBM&q=85&s=70c520154ec72ec79f88a4af44e6f733" alt="Addison runs verification and highlights issues" width="2181" height="1251" data-path="images/verification in chat.png" />
</Frame>

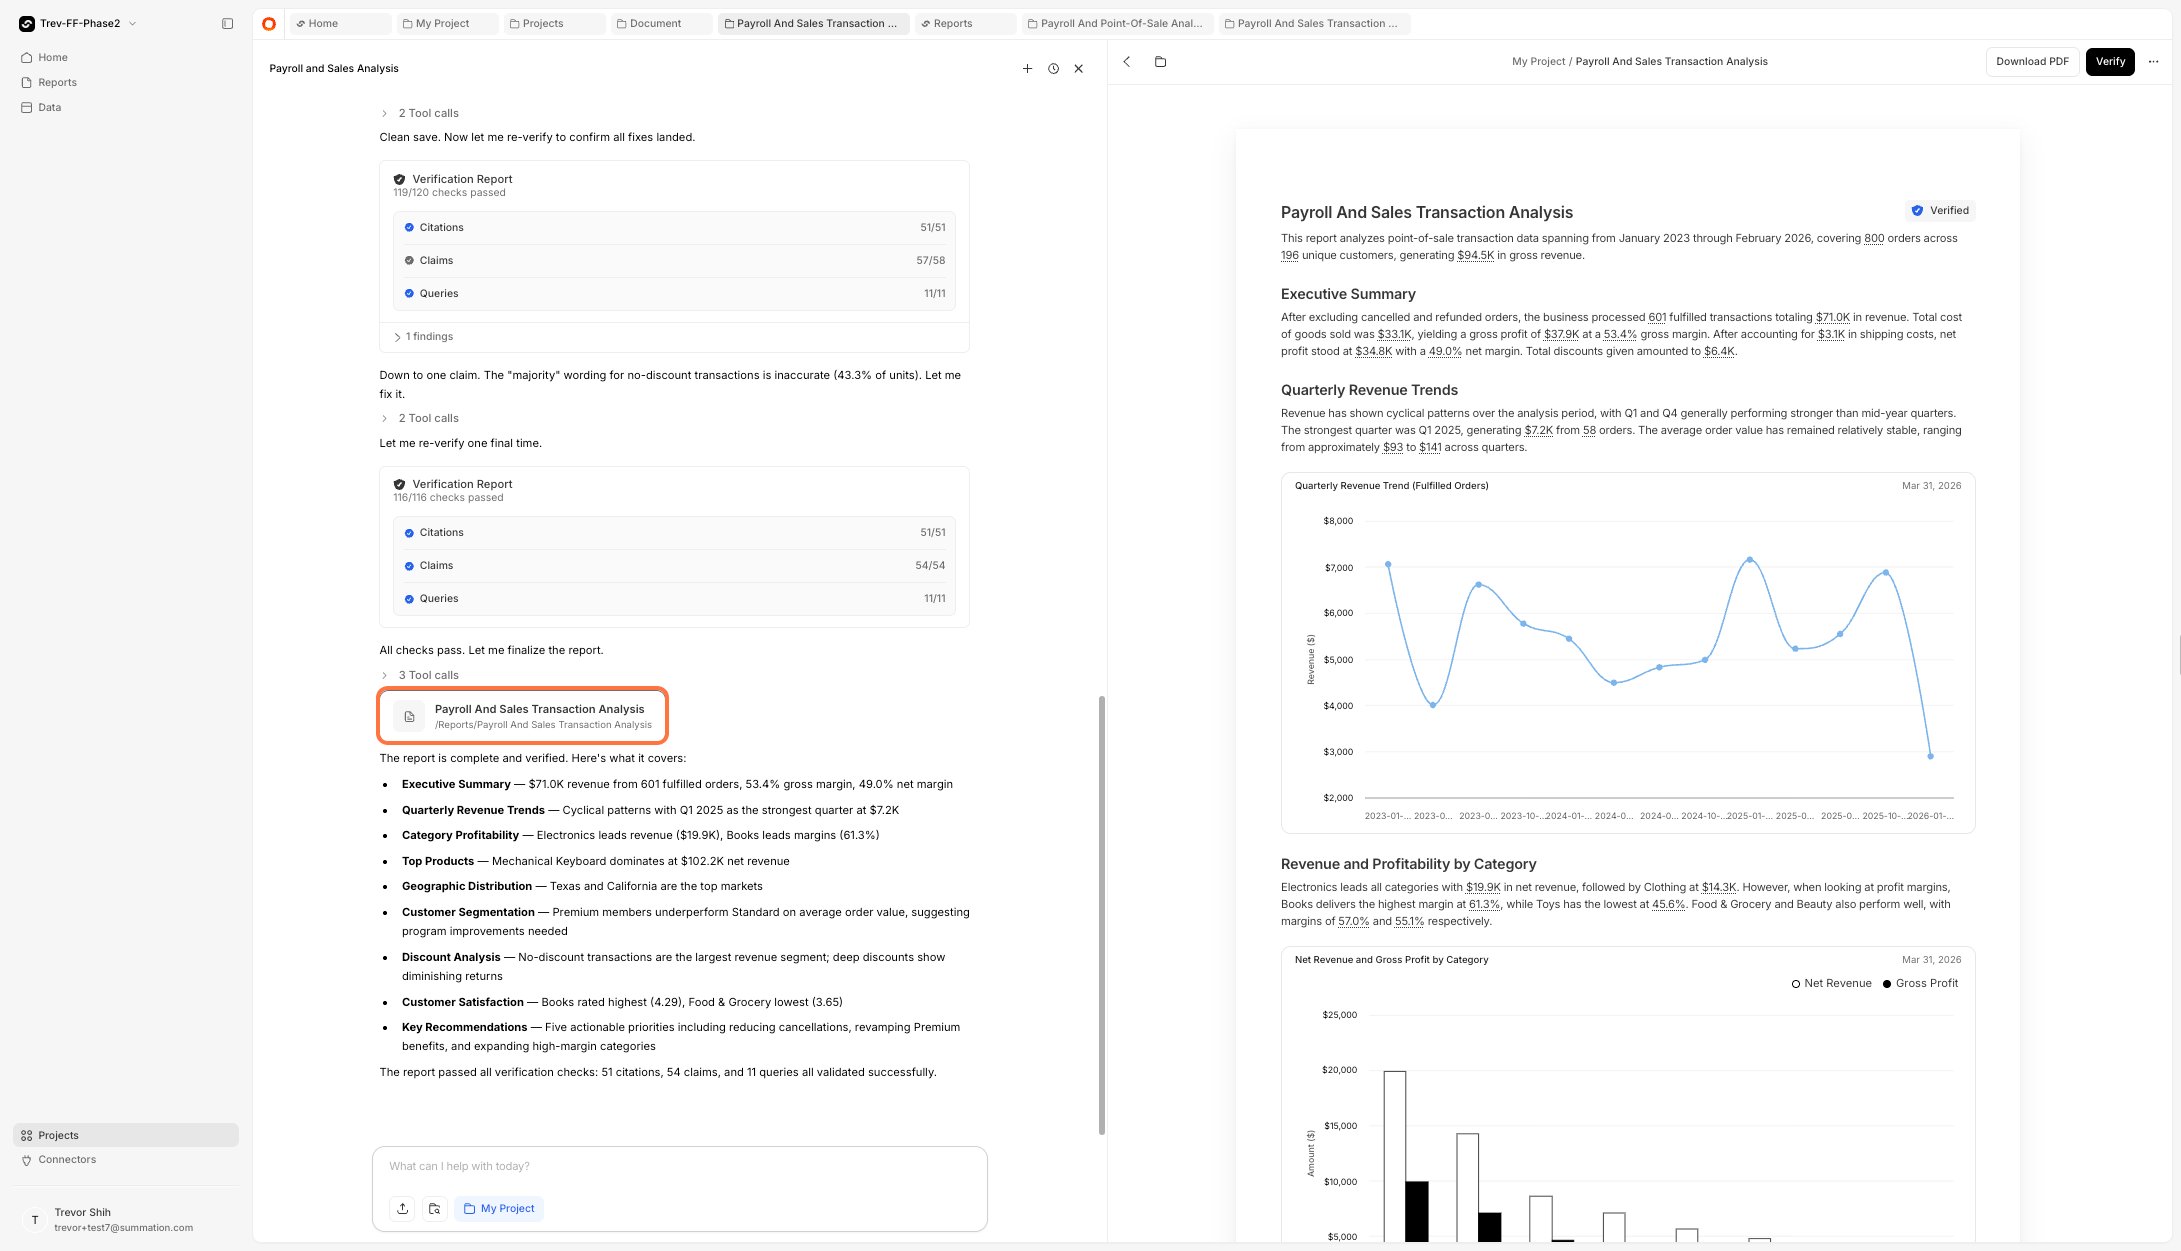
After verification completes, your report appears in chat with a **Verified** badge.
<Frame>
  <img src="https://mintcdn.com/summation-676748f5-docs-api-and-integrations/zweiW-5lpFAjuEBM/images/completed%20report%20in%20chat.png?fit=max&auto=format&n=zweiW-5lpFAjuEBM&q=85&s=7dd783152dec45d02c850511bb4b166a" alt="Completed report appears in chat" width="2181" height="1251" data-path="images/completed report in chat.png" />
</Frame>

<Frame>
  <img src="https://mintcdn.com/summation-676748f5-docs-api-and-integrations/zweiW-5lpFAjuEBM/images/report%20with%20verified%20badge.png?fit=max&auto=format&n=zweiW-5lpFAjuEBM&q=85&s=e1b6f33ad5ef1d56cad4d1fcdc1f2e8c" alt="Report with Verified badge" width="2181" height="1251" data-path="images/report with verified badge.png" />
</Frame>

## Ask follow-up questions

There are two ways to ask questions about your report.

### Option 1: Comment on the report

<Steps>
  <Step title="Highlight text to comment">
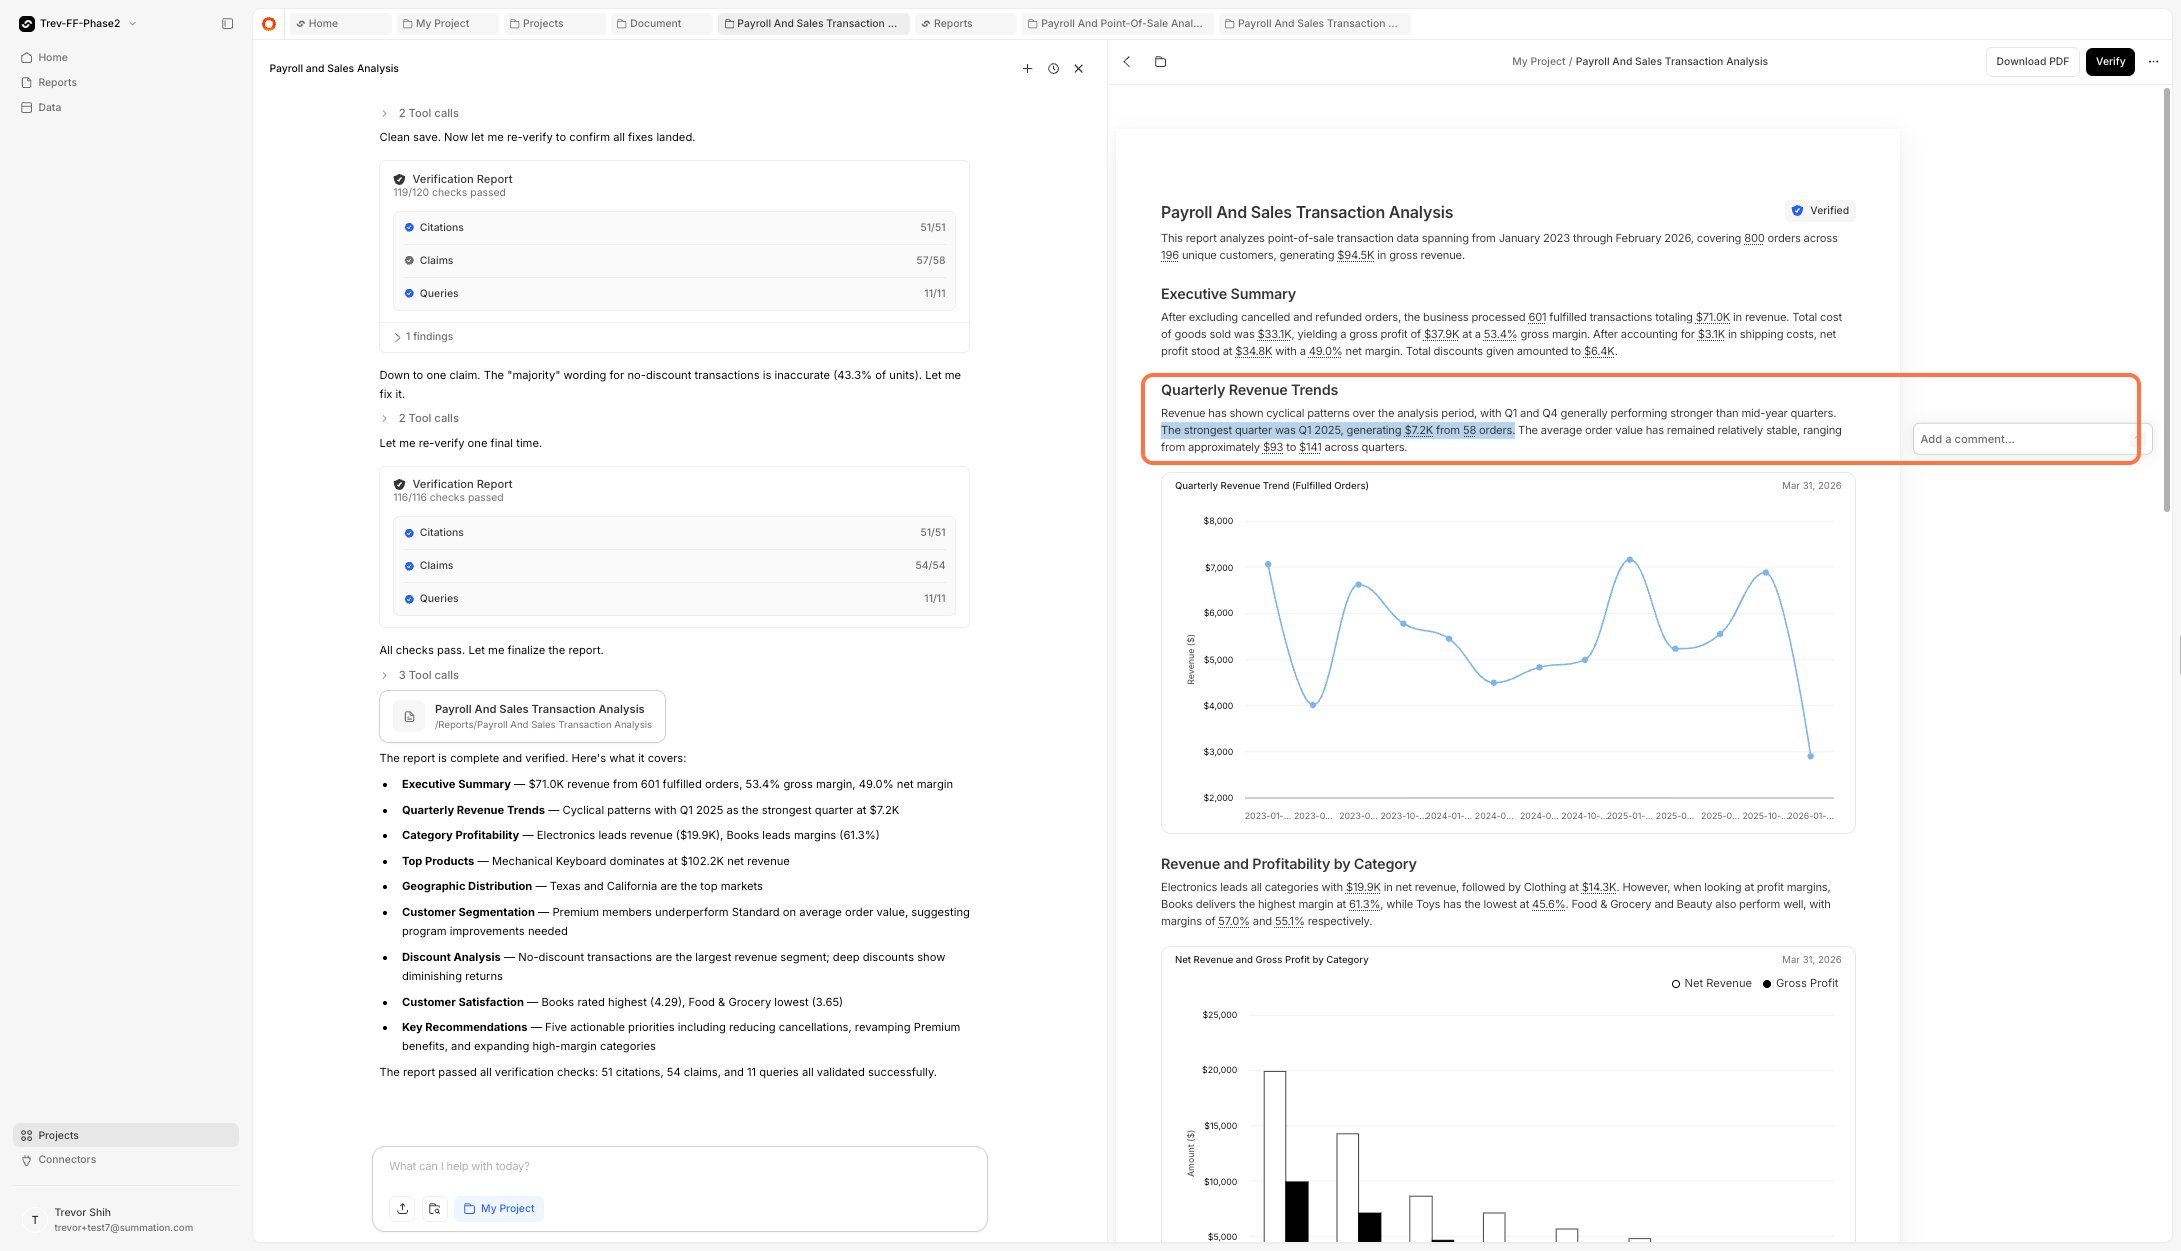
    Highlight an area of the report to open a comment box.
    <Frame>
      <img src="https://mintcdn.com/summation-676748f5-docs-api-and-integrations/zweiW-5lpFAjuEBM/images/highlighted%20report%20text%20with%20comment%20box.png?fit=max&auto=format&n=zweiW-5lpFAjuEBM&q=85&s=a0b38b7ce55d4e3e95b63bc56a12a65f" alt="Highlight text to open a comment box" width="2181" height="1251" data-path="images/highlighted report text with comment box.png" />
    </Frame>
  </Step>

  <Step title="@mention Addison">
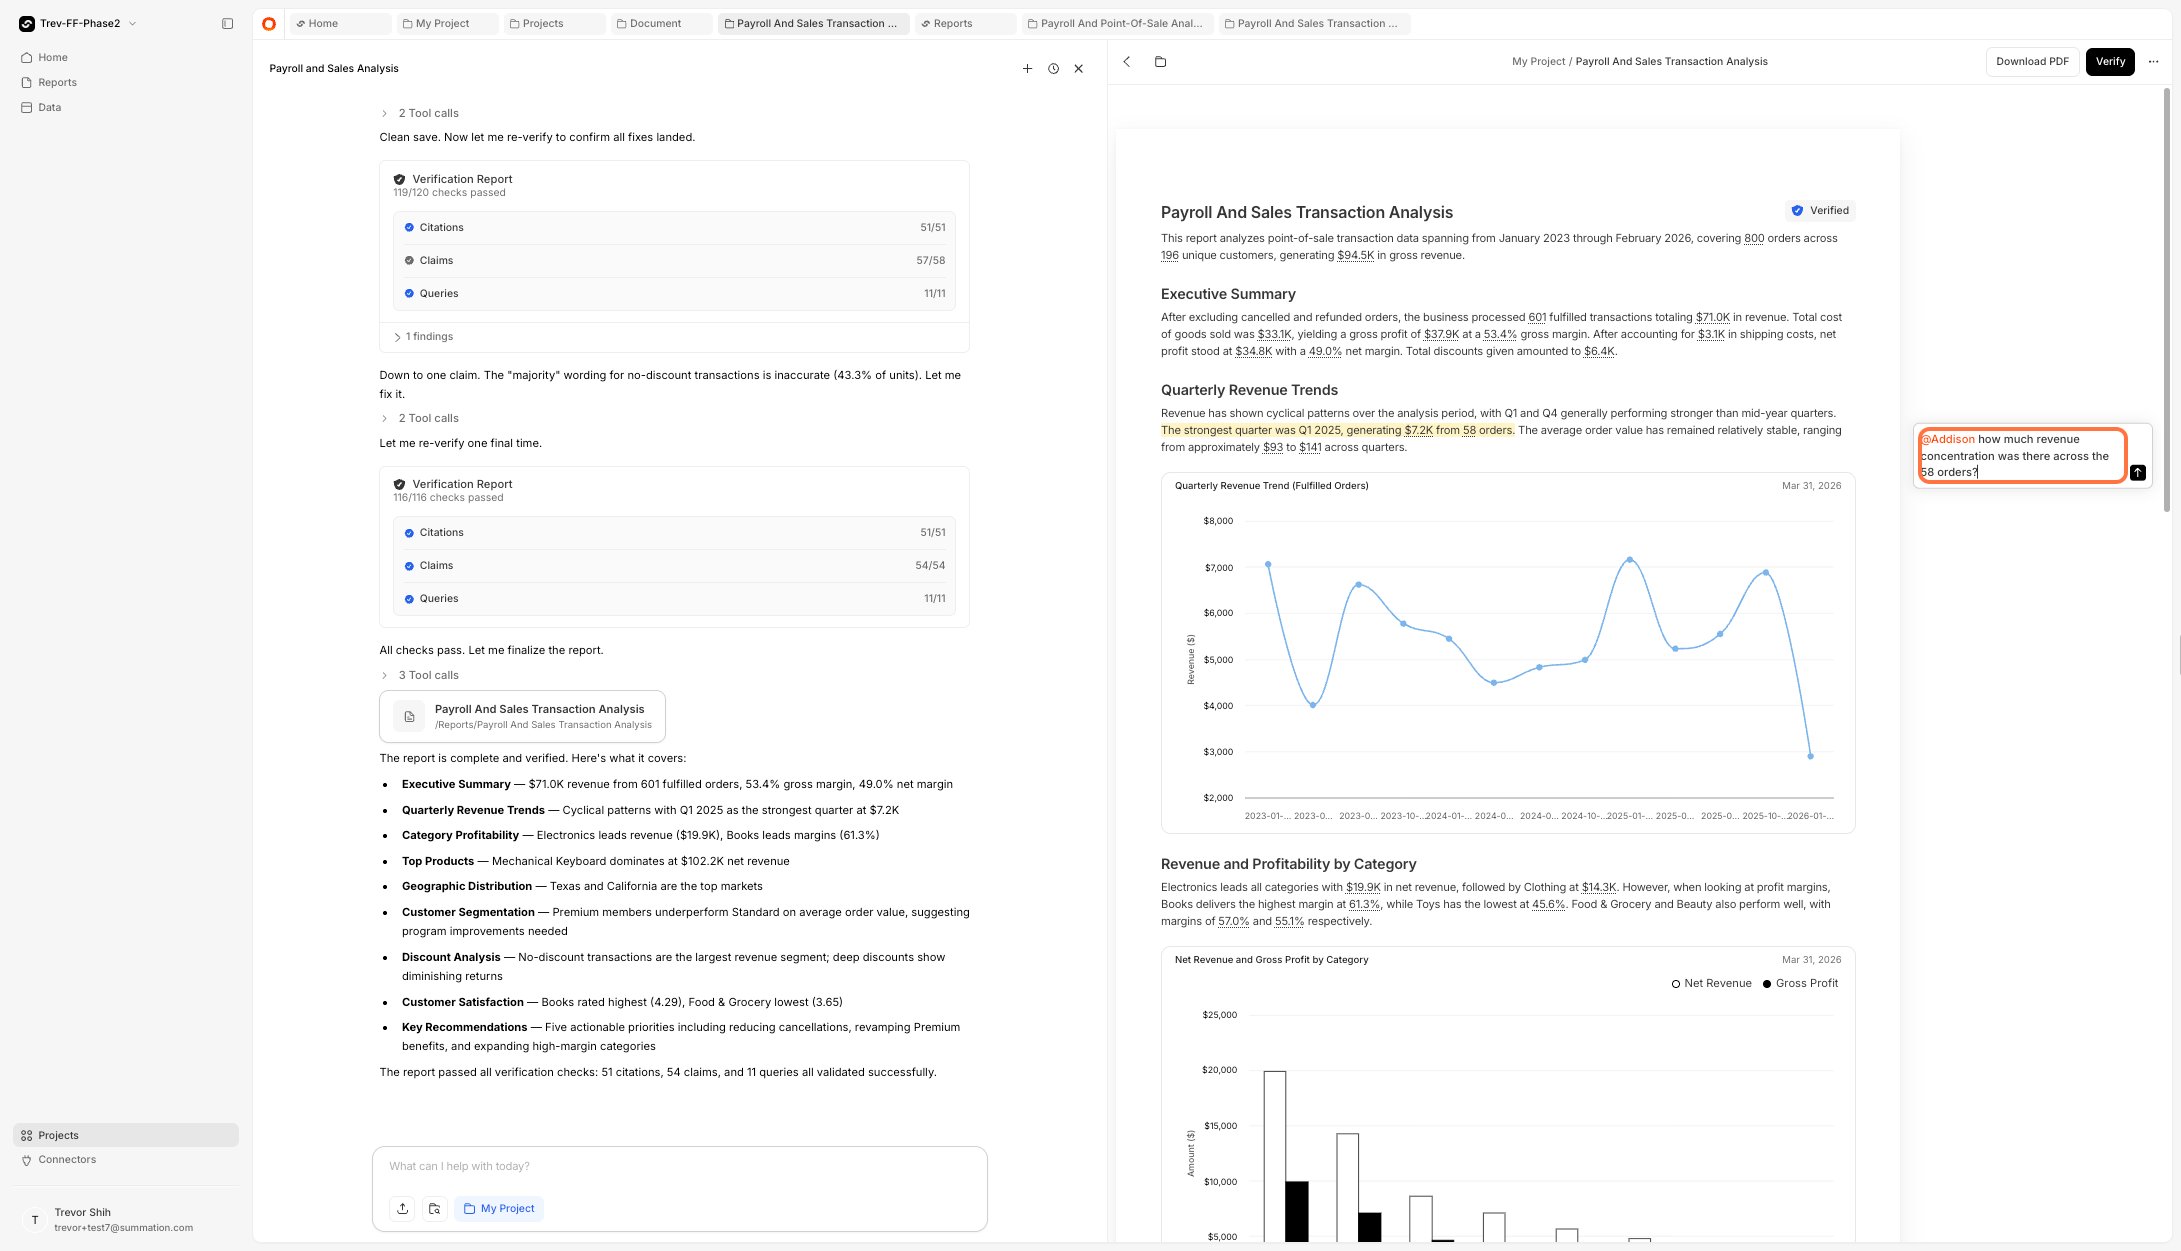
    Type your question and **@mention Addison** to get a response.
    <Frame>
      <img src="https://mintcdn.com/summation-676748f5-docs-api-and-integrations/zweiW-5lpFAjuEBM/images/comment%20with%20addison%20mention.webp?fit=max&auto=format&n=zweiW-5lpFAjuEBM&q=85&s=047c2a3f5b5e8e851f4b150cd25af214" alt="Comment with @Addison mention" width="2181" height="1251" data-path="images/comment with addison mention.webp" />
    </Frame>
  </Step>

  <Step title="View the reply">
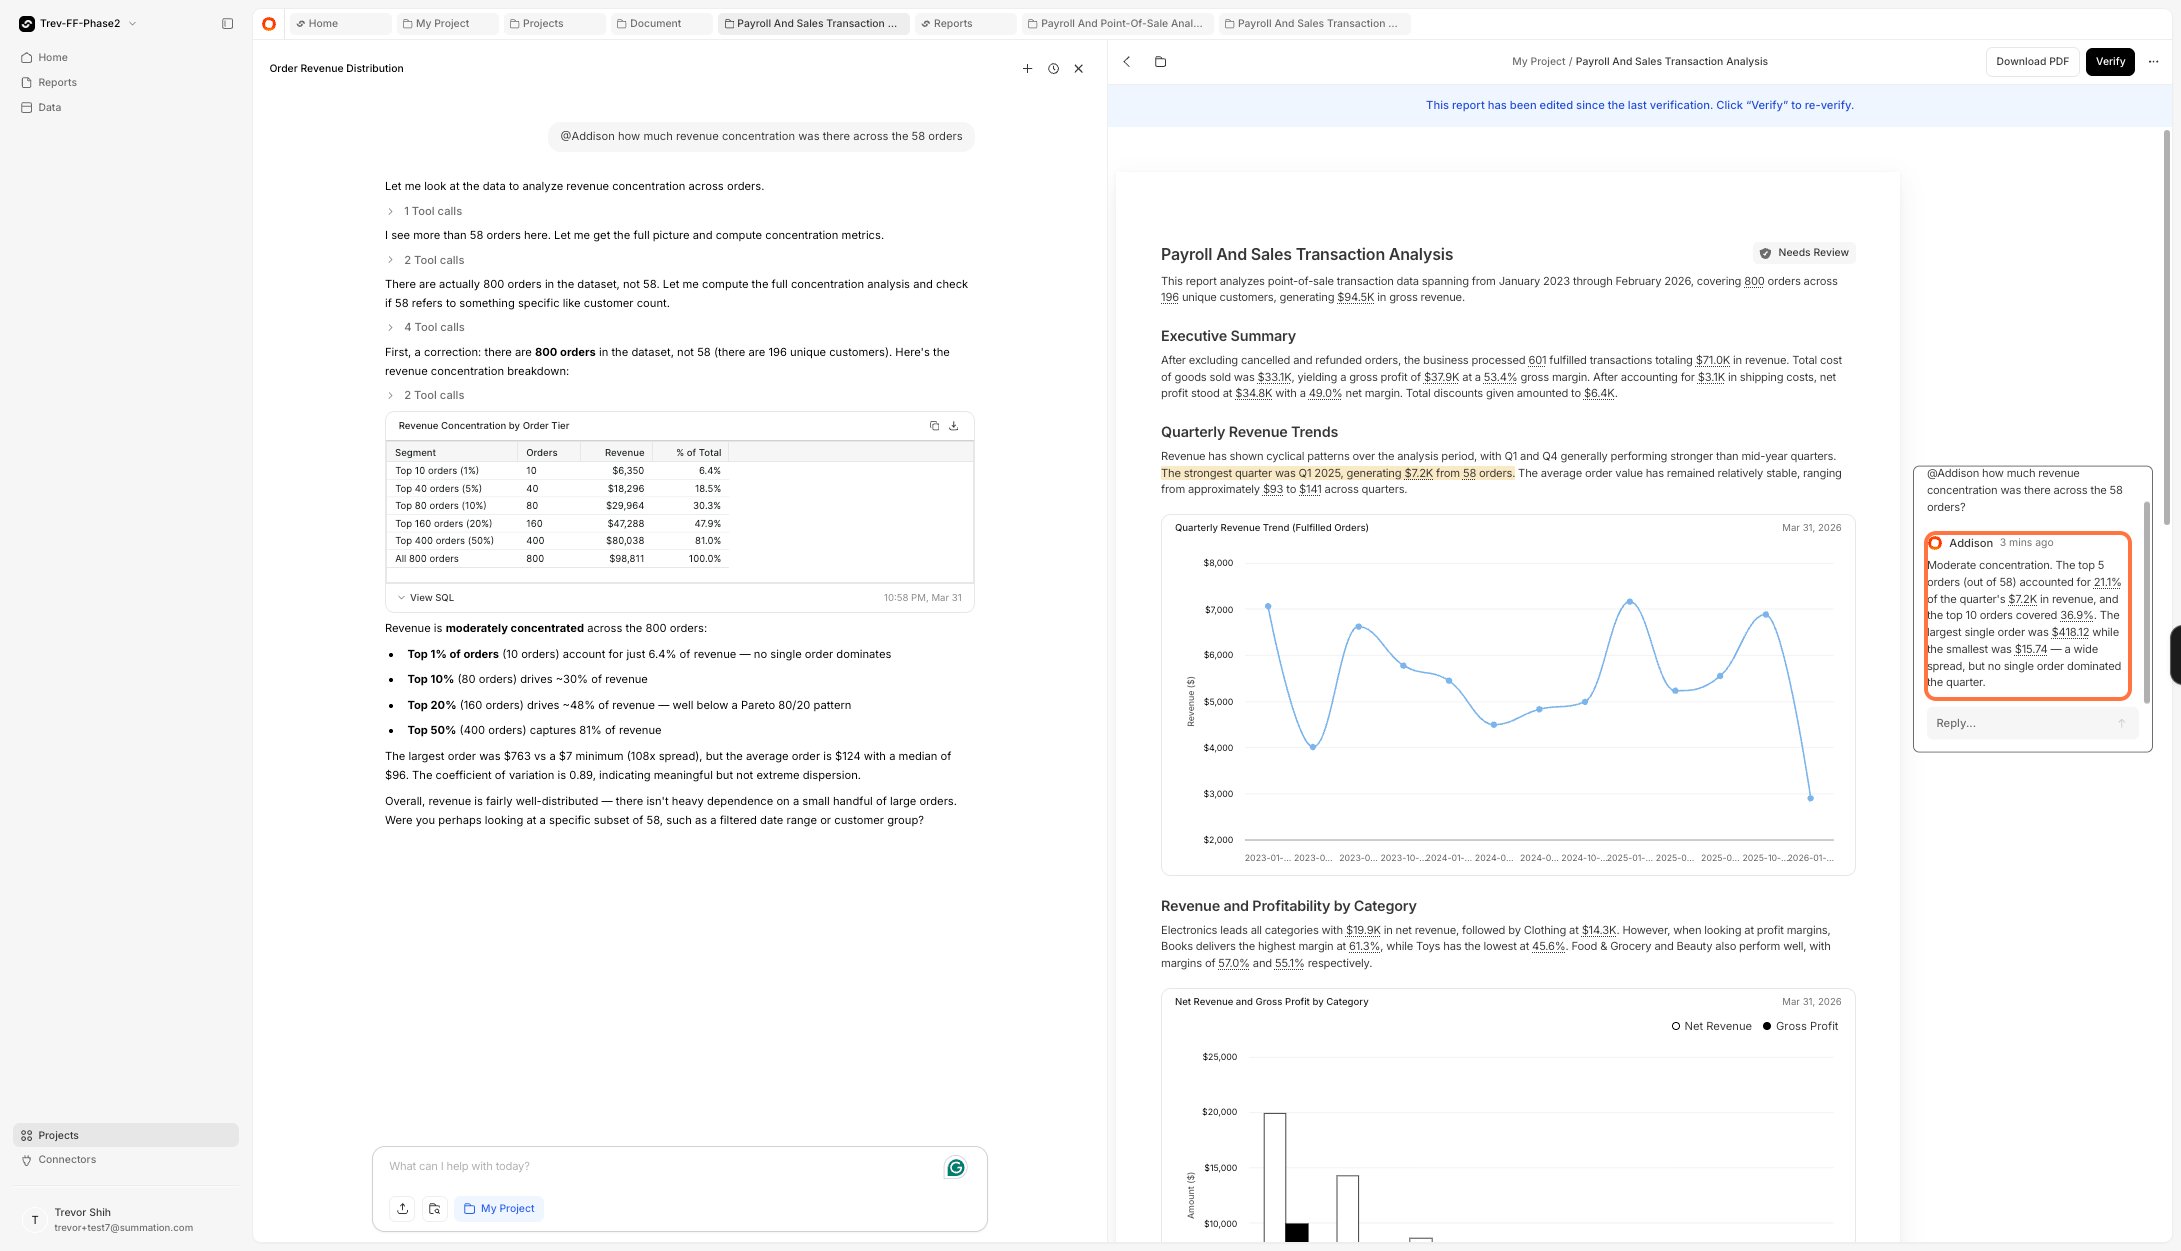
    Addison replies directly in the comment thread. Click on the reply to see the full detail.
    <Frame>
      <img src="https://mintcdn.com/summation-676748f5-docs-api-and-integrations/zweiW-5lpFAjuEBM/images/addison%20reply%20in%20comment%20thread.webp?fit=max&auto=format&n=zweiW-5lpFAjuEBM&q=85&s=fd5e7c0151eaa0edaf9986067b5d4c4f" alt="Addison's reply in comment thread" width="2181" height="1251" data-path="images/addison reply in comment thread.webp" />
    </Frame>
  </Step>
</Steps>

### Option 2: Ask in the chat thread

<Steps>
  <Step title="Open Addison">
    Click the orange Addison icon to open a chat.
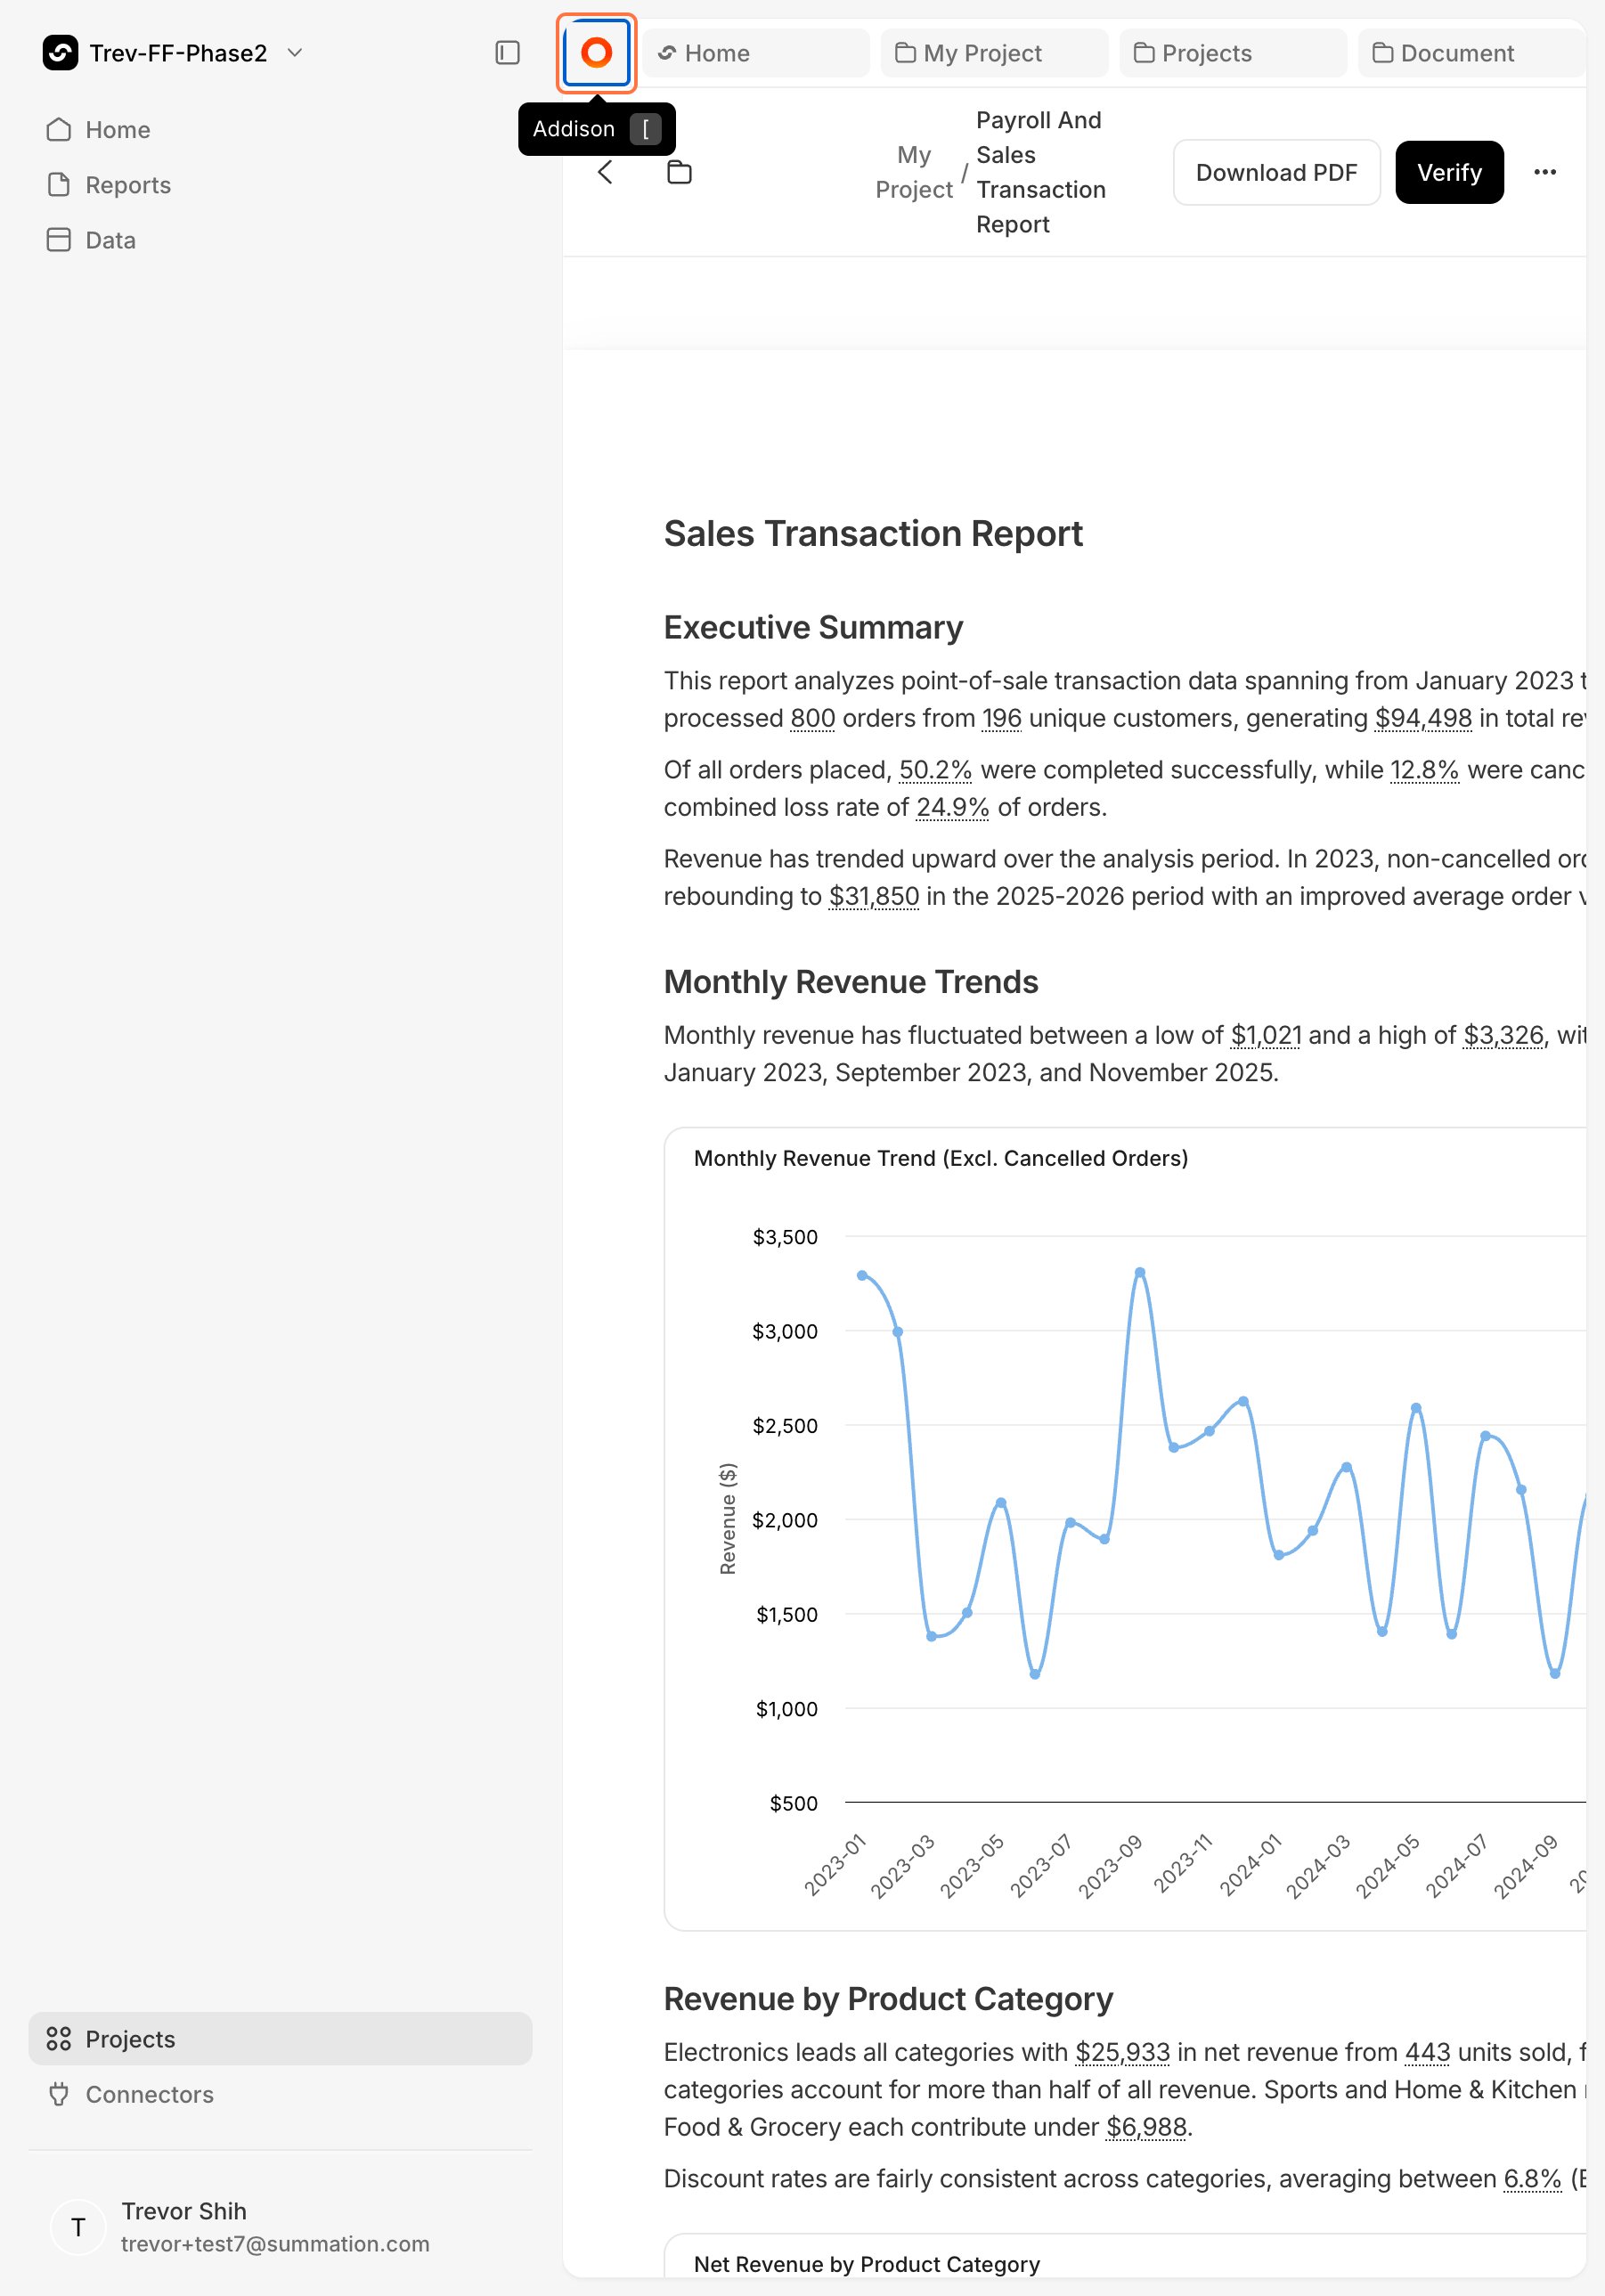
    <Frame>
      <img src="https://mintcdn.com/summation-676748f5-docs-api-and-integrations/zweiW-5lpFAjuEBM/images/addison%20chat%20open.png?fit=max&auto=format&n=zweiW-5lpFAjuEBM&q=85&s=dfab4ffb99c6afdfcd443634c182e566" alt="Addison chat open" width="1802" height="2578" data-path="images/addison chat open.png" />
    </Frame>
  </Step>

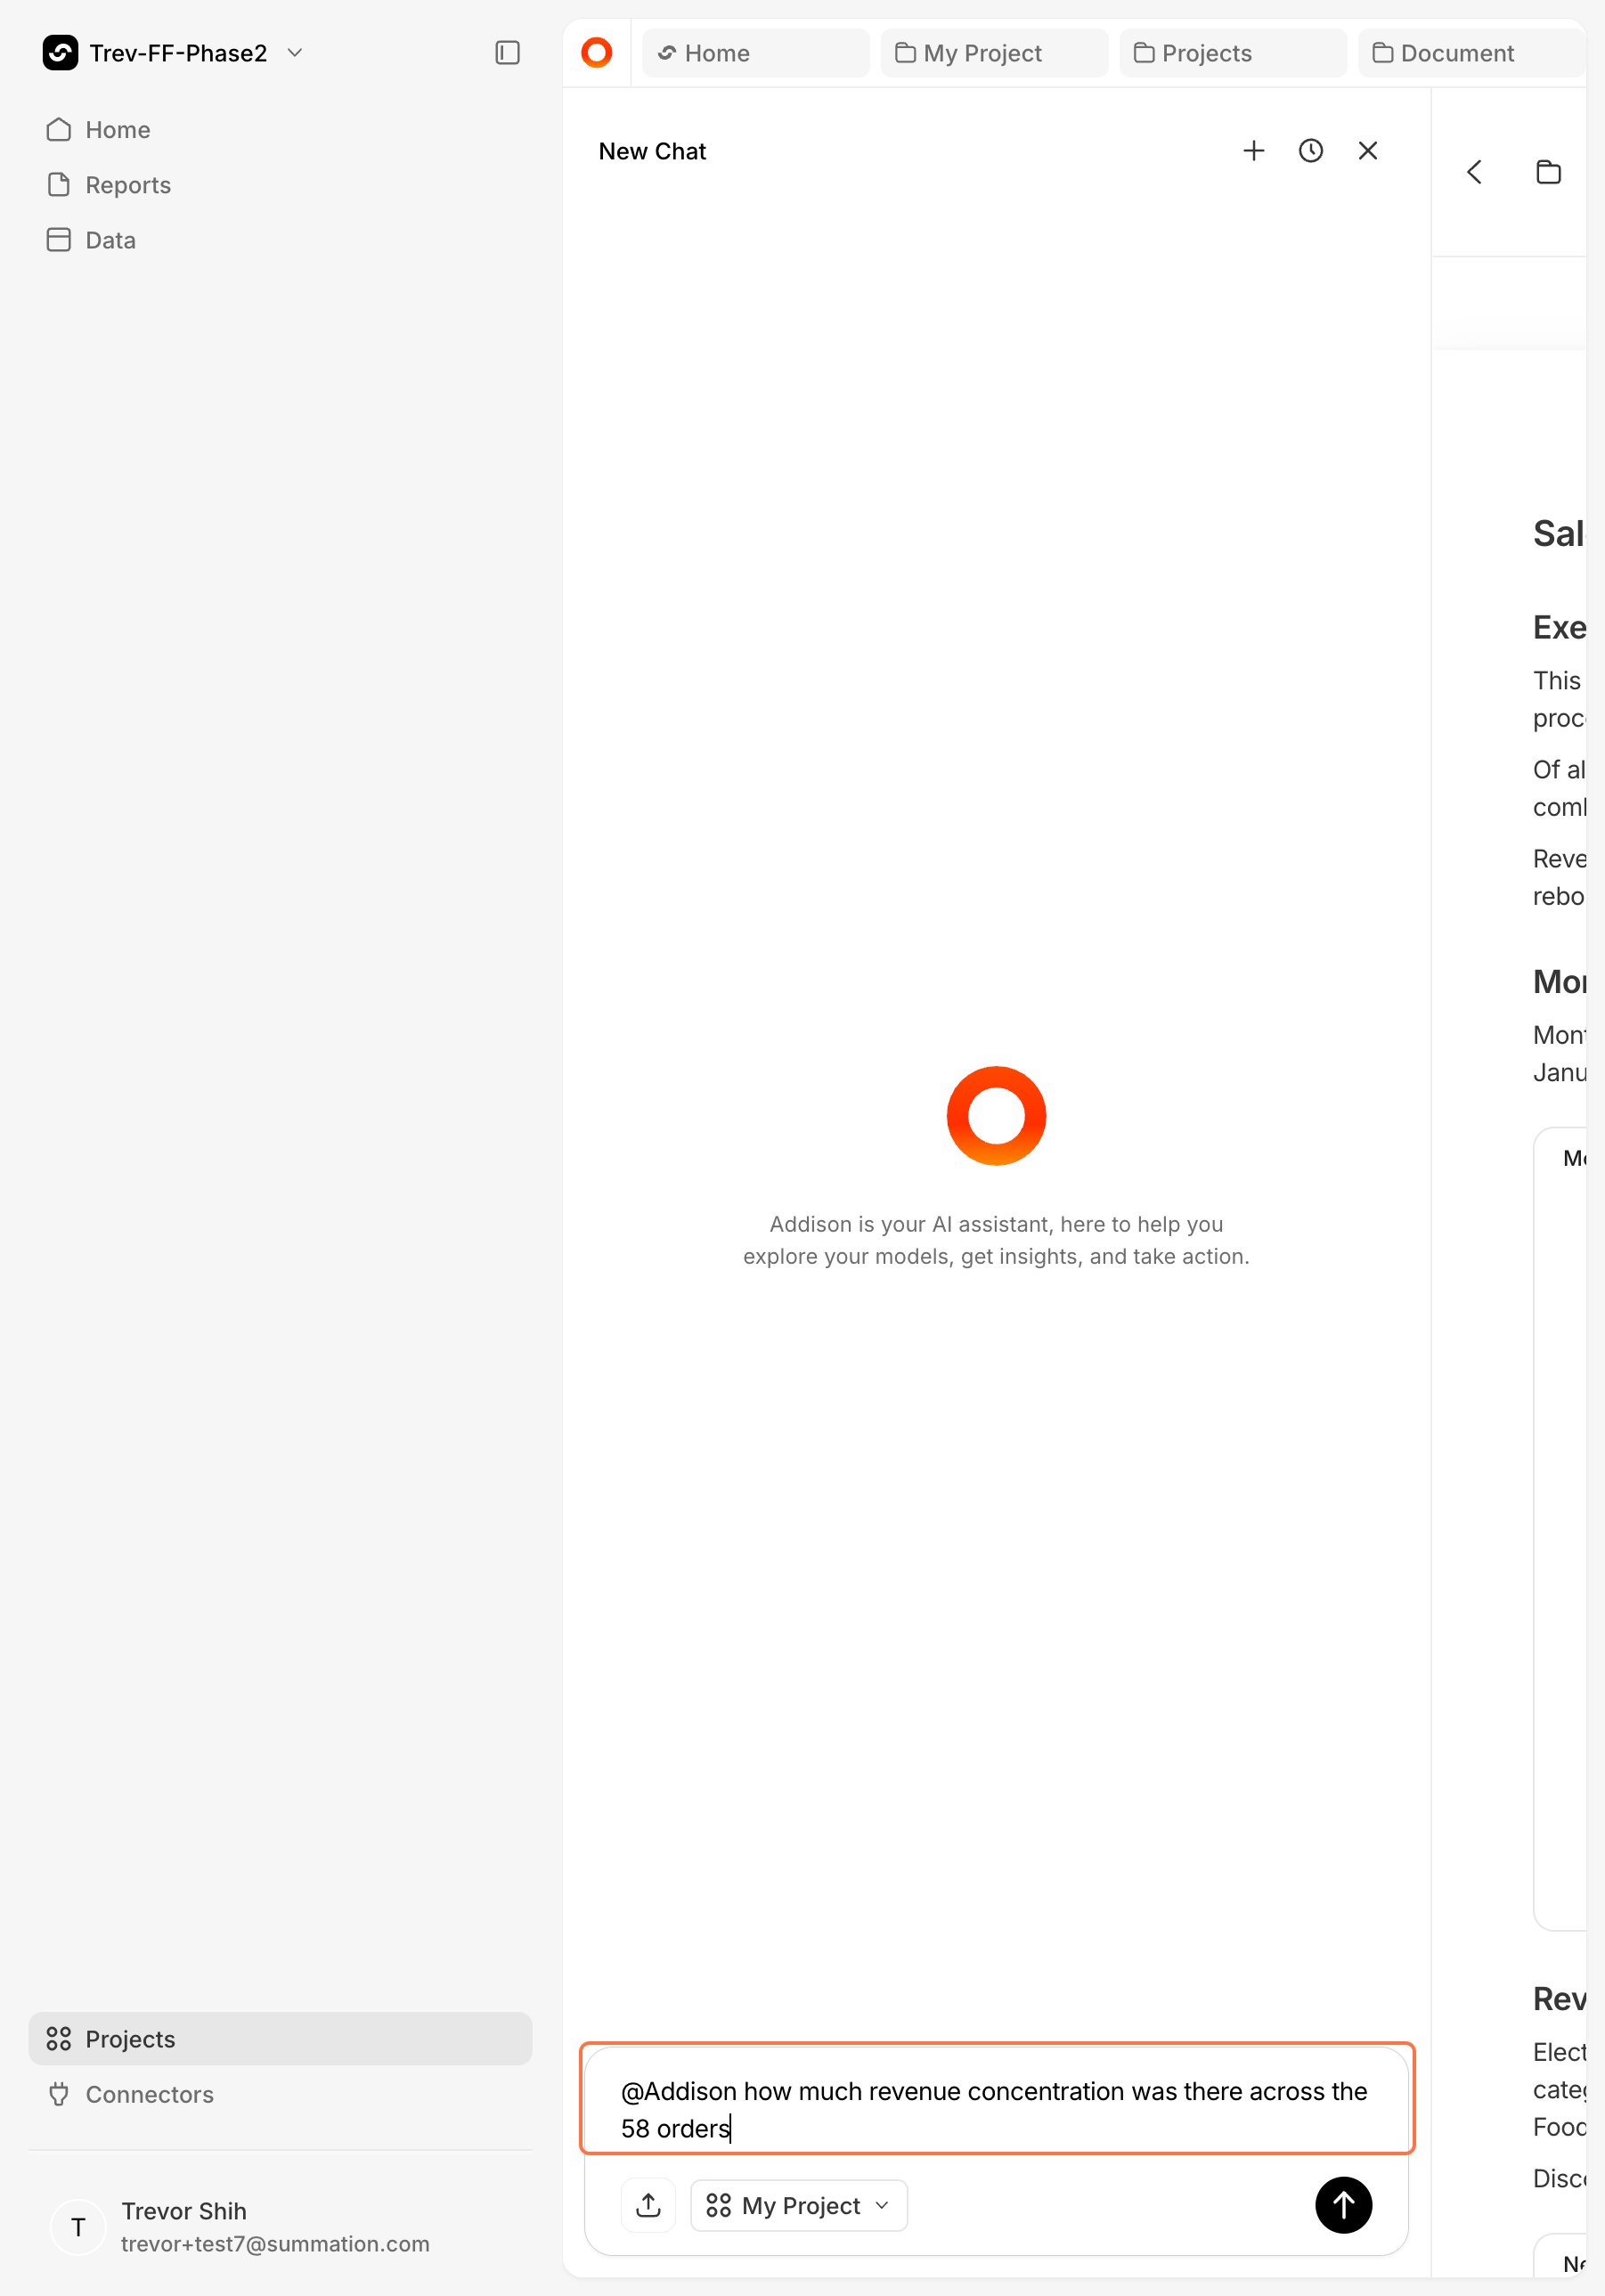
  <Step title="Type your question">
    Ask your question in the chat window.

    <Frame>
      <img src="https://mintcdn.com/summation-676748f5-docs-api-and-integrations/zweiW-5lpFAjuEBM/images/question%20typed%20in%20chat.png?fit=max&auto=format&n=zweiW-5lpFAjuEBM&q=85&s=9af3b383407ddeb9a8766f705d973419" alt="Question typed in chat" width="1802" height="2578" data-path="images/question typed in chat.png" />
    </Frame>
  </Step>

  <Step title="View the response">
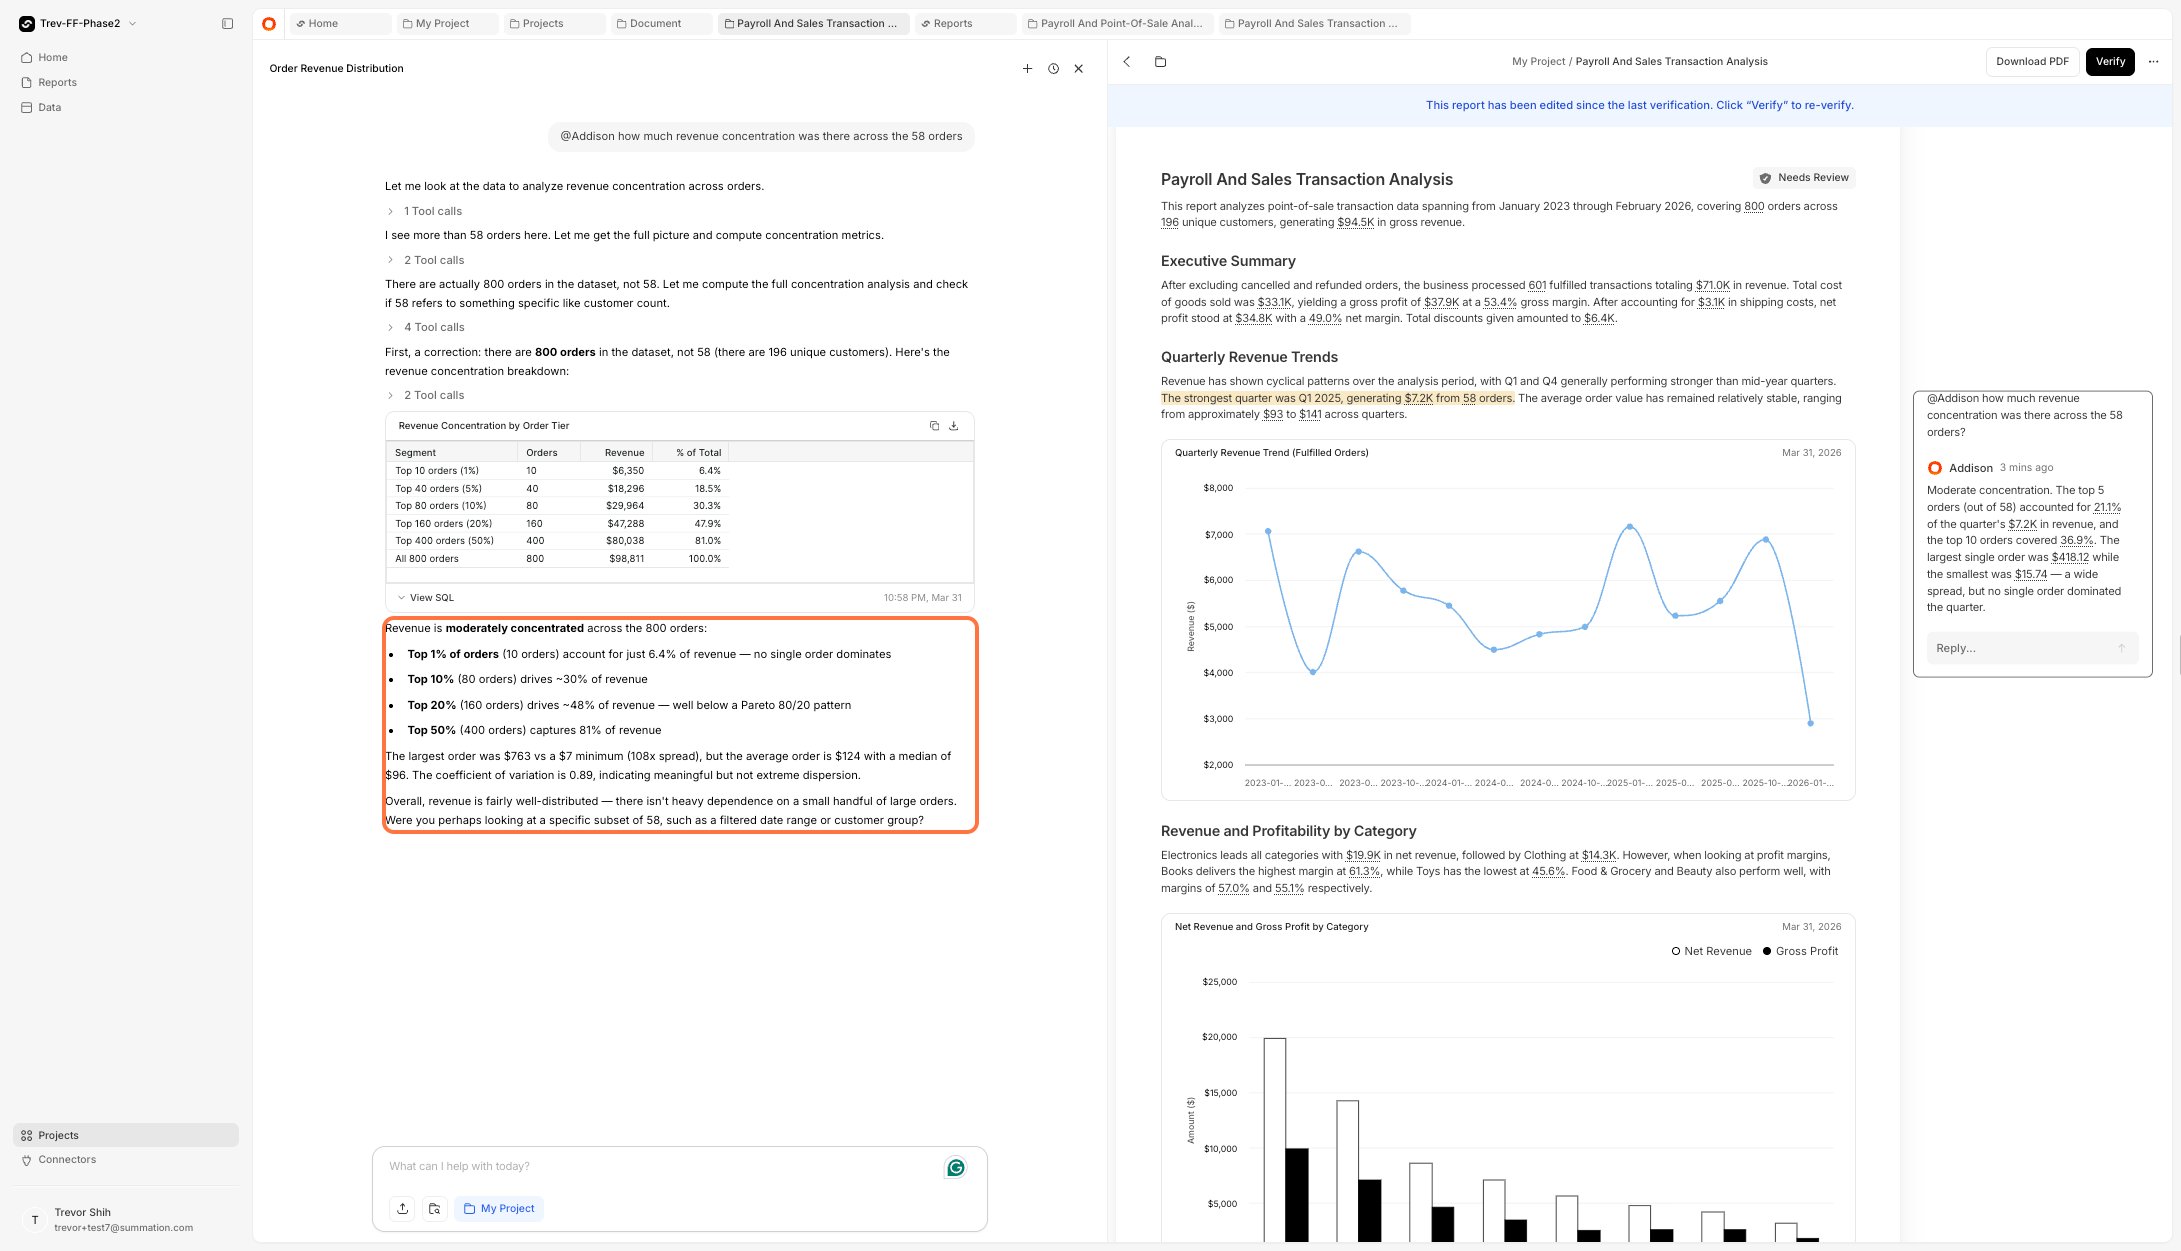
    Addison replies with a detailed explanation.
    <Frame>
      <img src="https://mintcdn.com/summation-676748f5-docs-api-and-integrations/zweiW-5lpFAjuEBM/images/addison%20detailed%20reply%20in%20chat.png?fit=max&auto=format&n=zweiW-5lpFAjuEBM&q=85&s=4d2f852e8cd90fb2cad9b0c63375923f" alt="Addison's detailed reply in chat" width="2181" height="1251" data-path="images/addison detailed reply in chat.png" />
    </Frame>
  </Step>
</Steps>

## Edit the report

To apply feedback across the report at once:

<Steps>
  <Step title="Add comments">
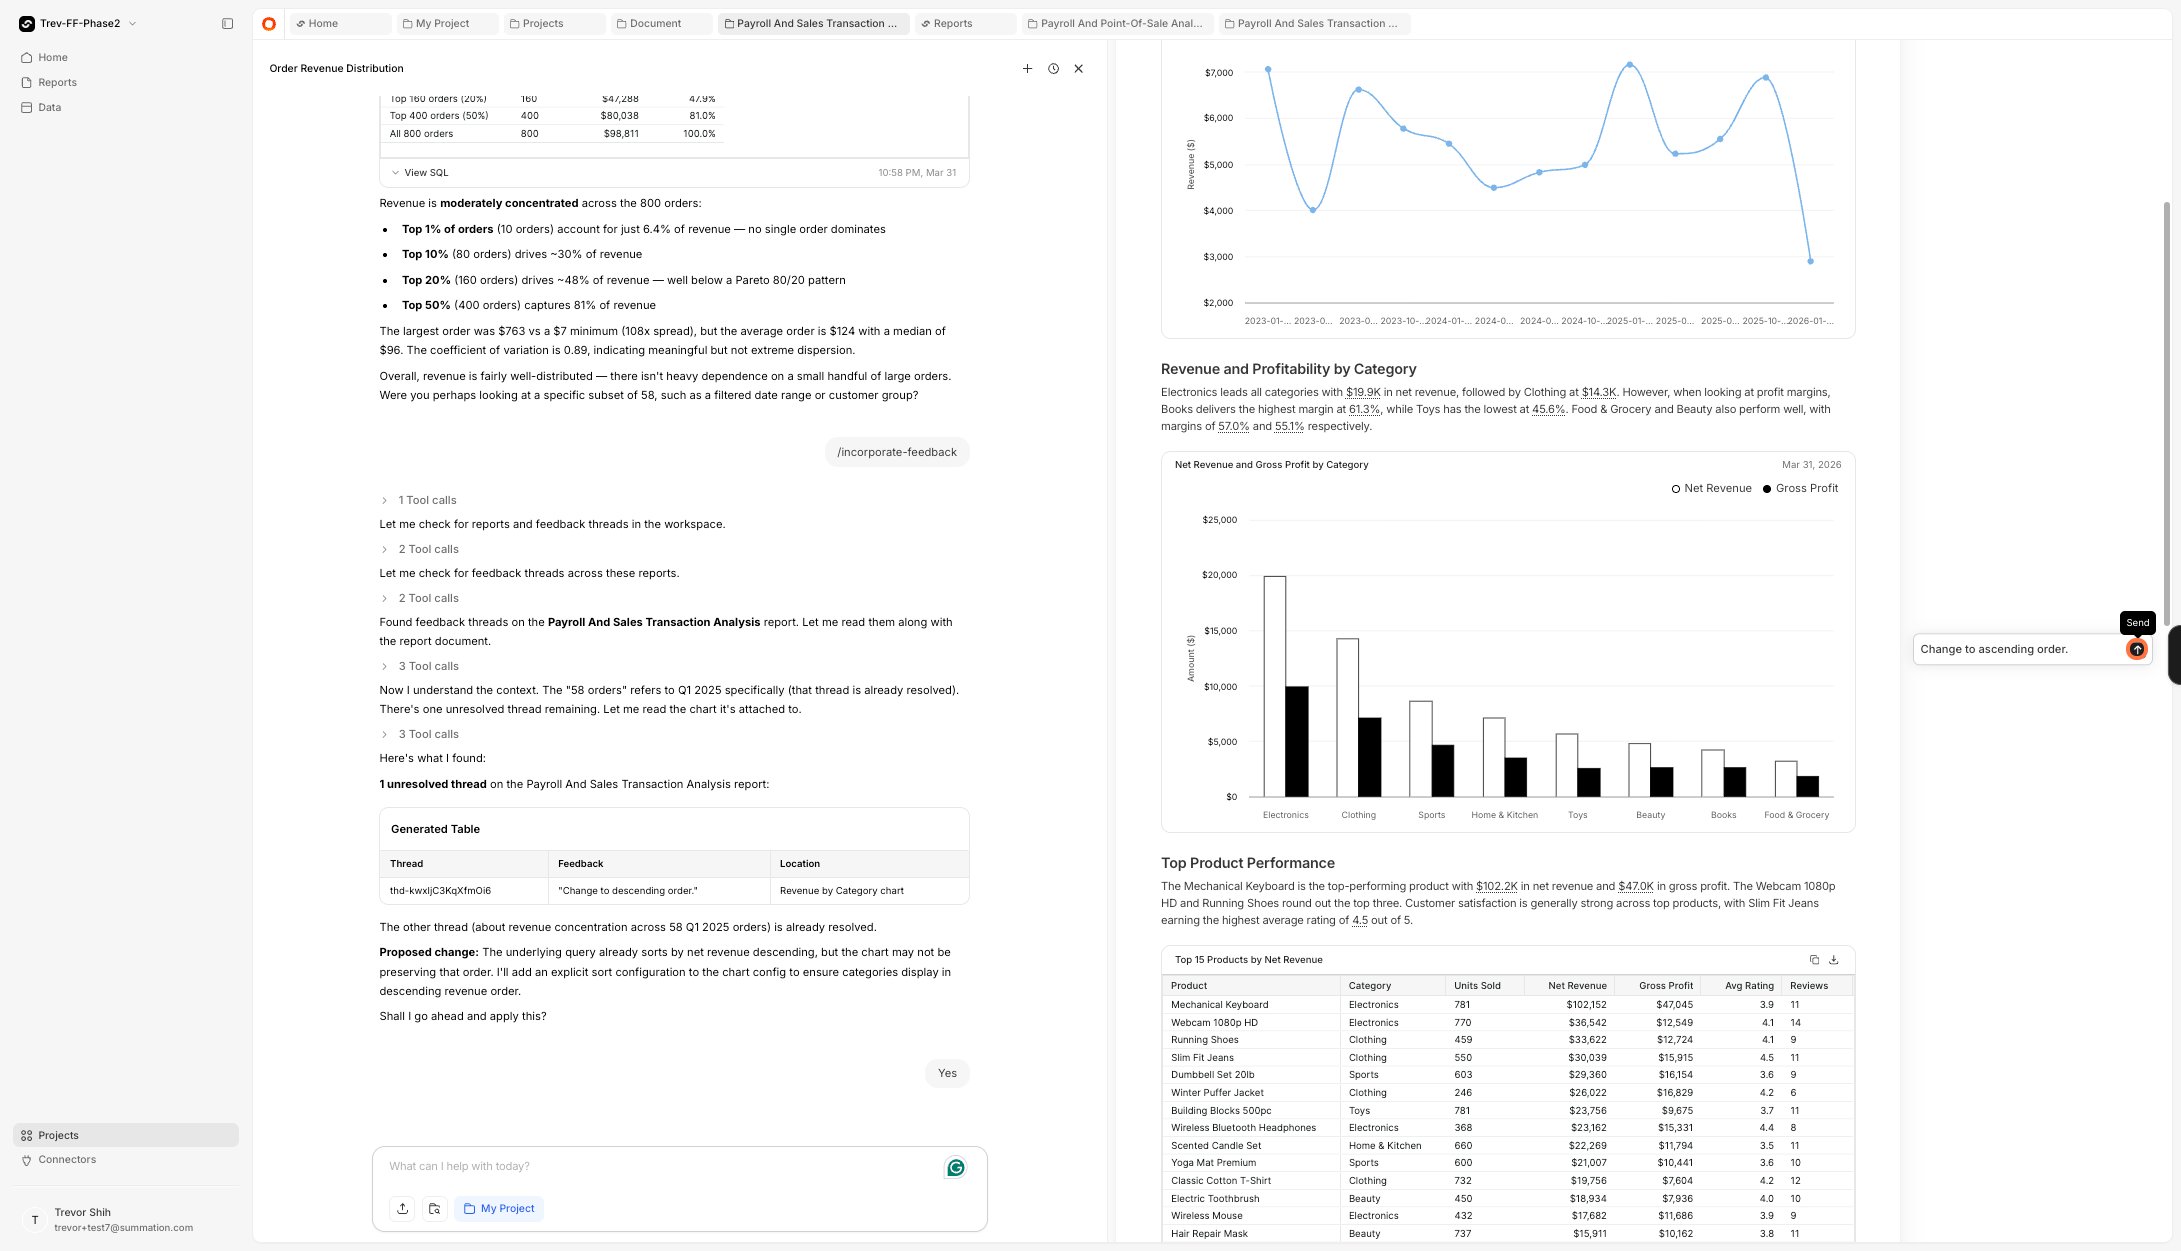
    Highlight areas of the report and leave comments with your requested changes.
    <Frame>
      <img src="https://mintcdn.com/summation-676748f5-docs-api-and-integrations/zweiW-5lpFAjuEBM/images/report%20comment%20with%20edit%20request.webp?fit=max&auto=format&n=zweiW-5lpFAjuEBM&q=85&s=a8328e6da907a98e206dc4cad26e3ab6" alt="Comment with edit request" width="2181" height="1251" data-path="images/report comment with edit request.webp" />
    </Frame>
  </Step>

  <Step title="Incorporate feedback">
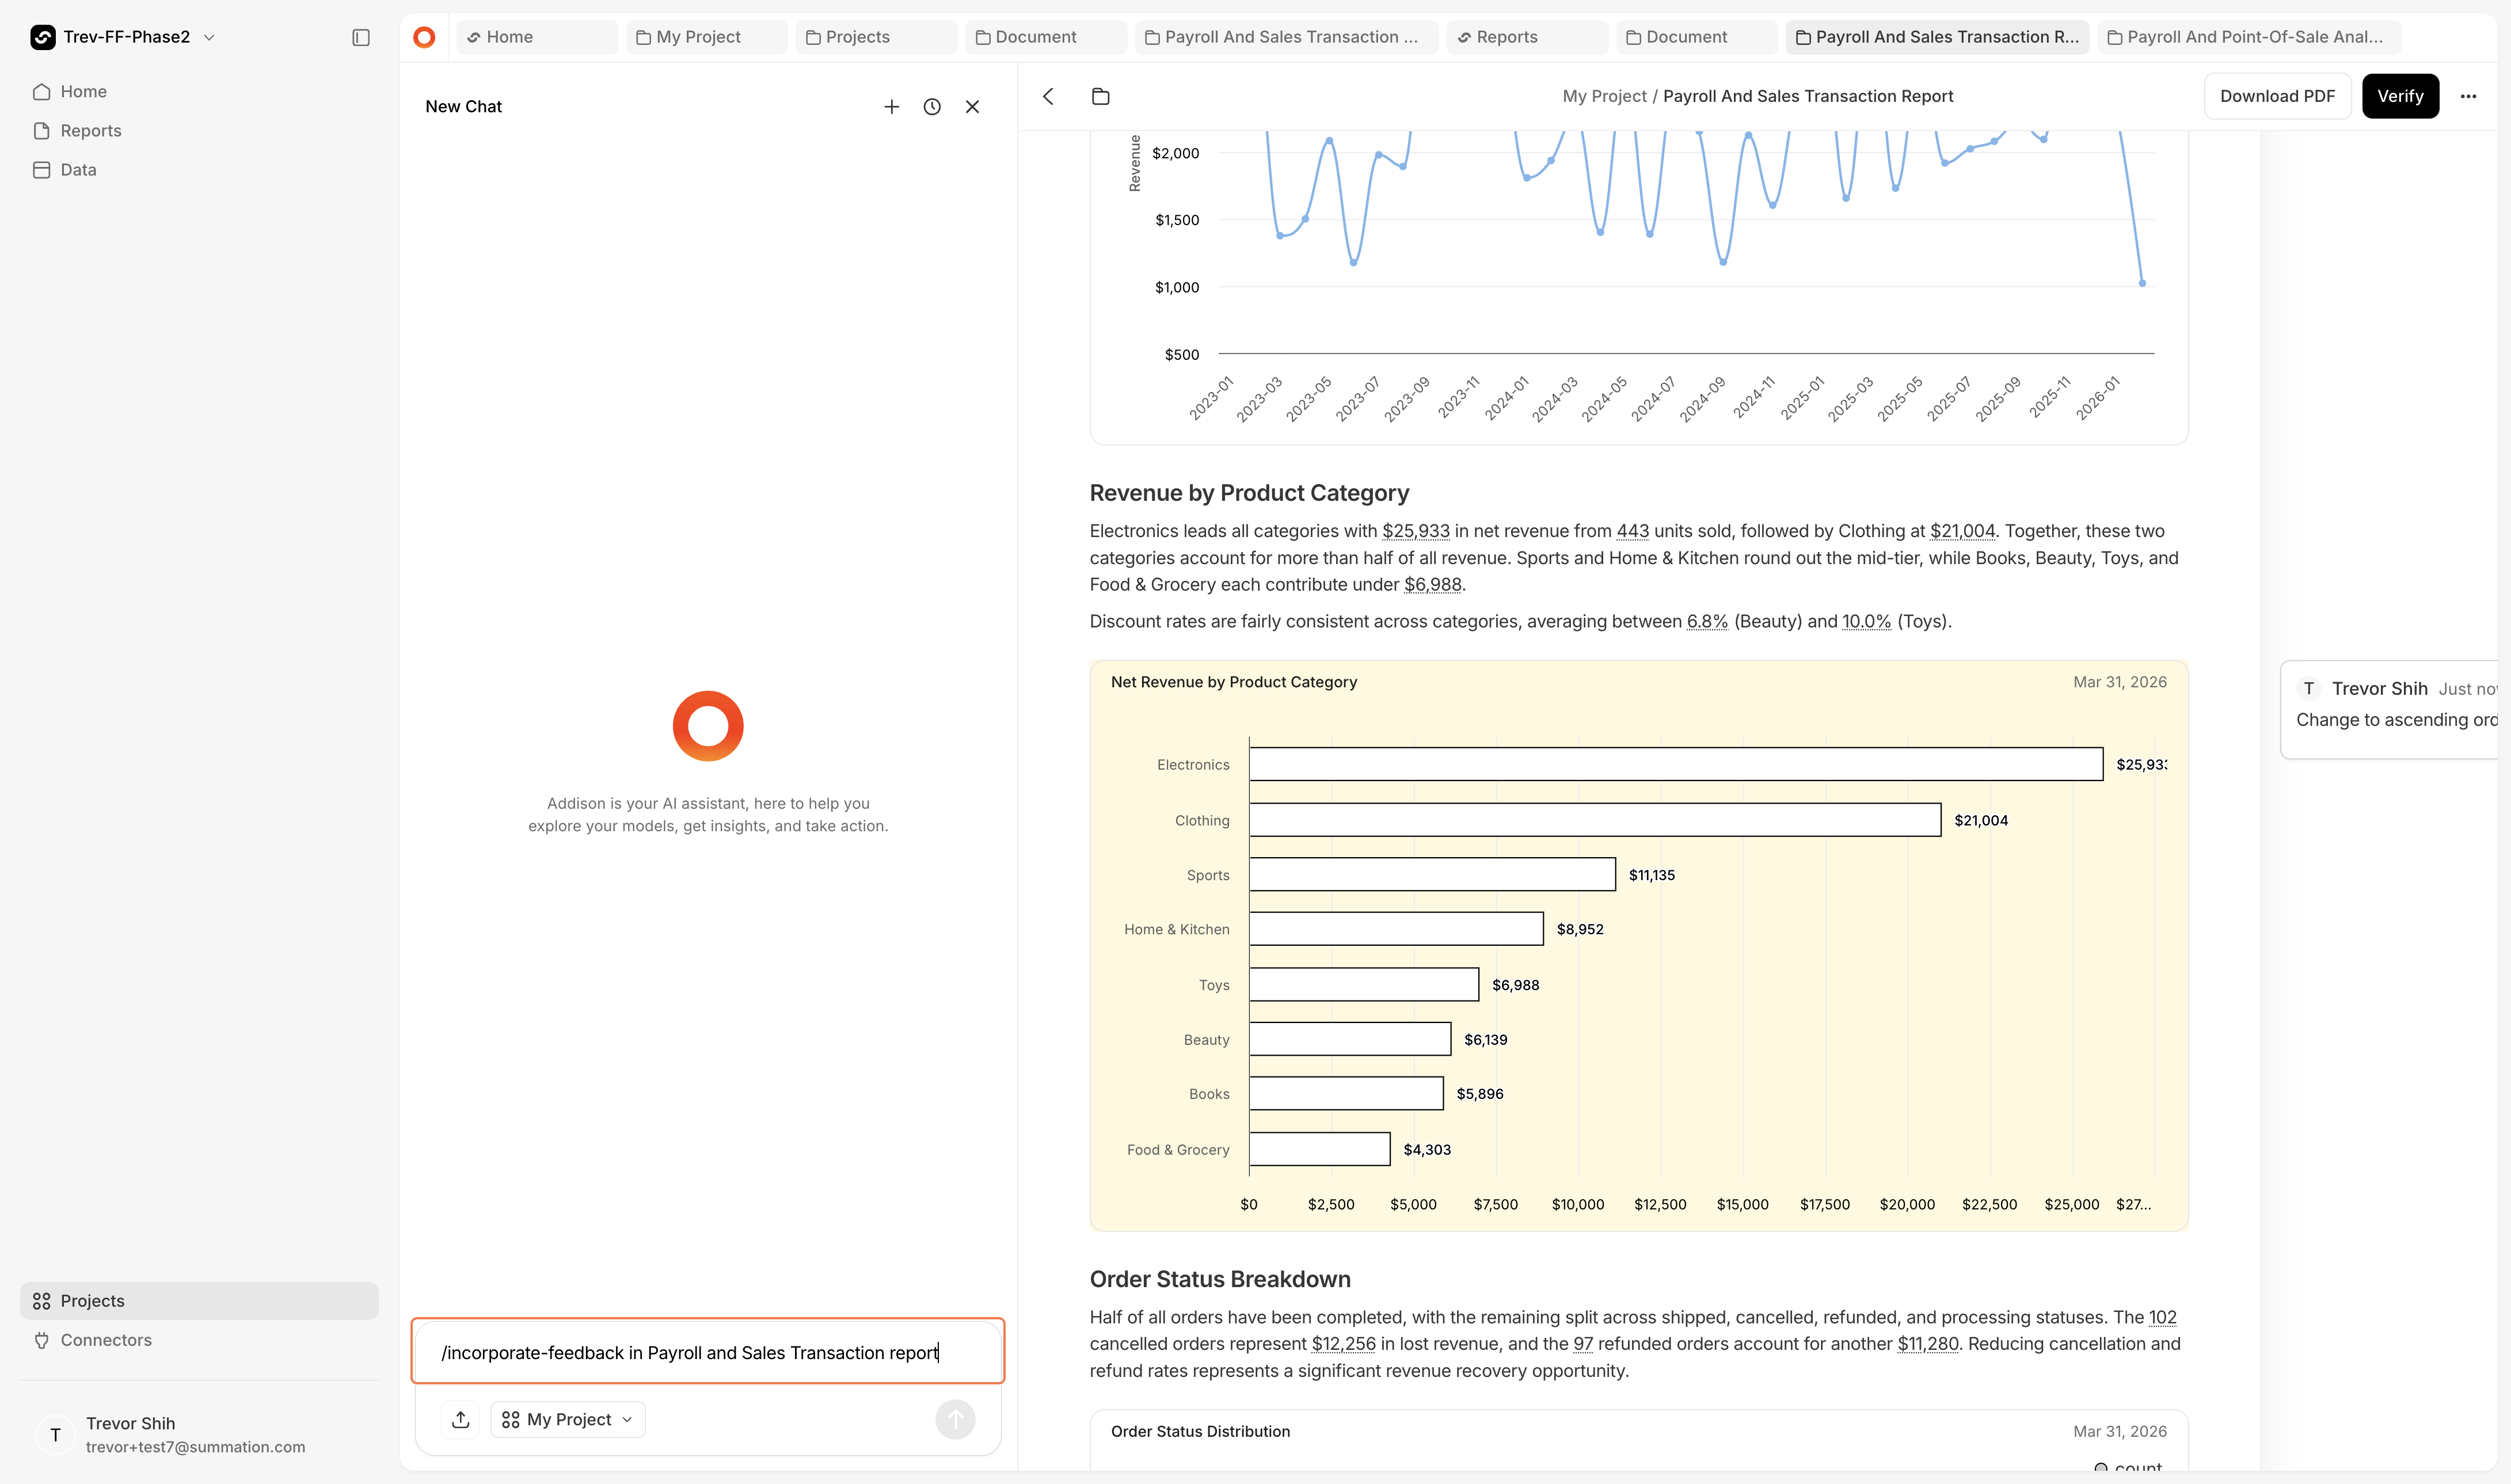
    Open the chat window and type `/incorporate-feedback` in your report name. Addison will review and execute all open comments.
    <Frame>
      <img src="https://mintcdn.com/summation-676748f5-docs-api-and-integrations/zweiW-5lpFAjuEBM/images/incorporate%20feedback%20command%20in%20chat.png?fit=max&auto=format&n=zweiW-5lpFAjuEBM&q=85&s=0300d52684e9f57e893567df36795dfb" alt="Incorporate feedback command in chat" width="4362" height="2578" data-path="images/incorporate feedback command in chat.png" />
    </Frame>
  </Step>
</Steps>

## Chat commands

You can run these commands in any Addison chat window:

| Command                                  | Description                                            |
| ---------------------------------------- | ------------------------------------------------------ |
| `/create-report [prompt]`                | Create a new report from chat                          |
| `/incorporate-feedback in [Report Name]` | Review and address open comments in a report           |
| `/verify-and-correct`                    | Run the verification process (same as clicking Verify) |